Comparison of microtreated Ion metering and Ion chromatography for the determination of fluoride in drinking water
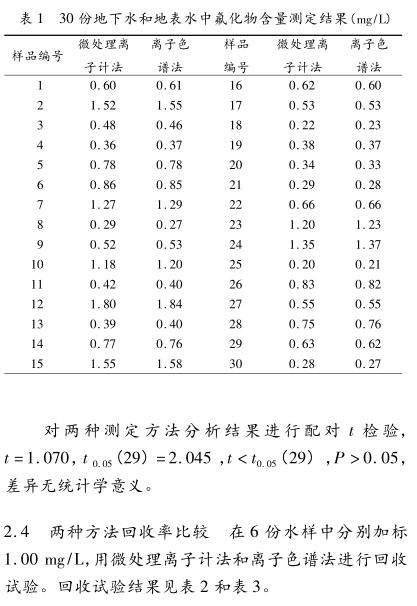
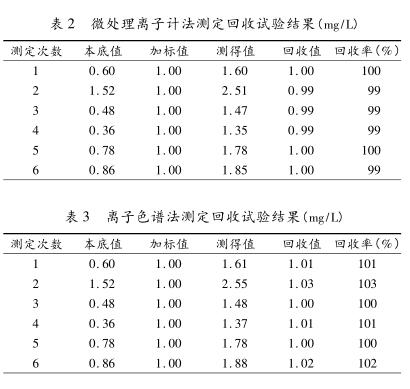
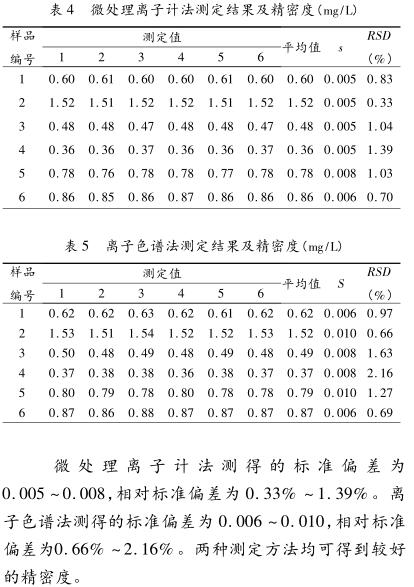
Objective: To compare the similarities and differences between the micro-processing Ion Meter and ion chromatography in the determination of fluoride in drinking water. Methods A total of 30 samples of groundwater and surface water were collected in Xuzhou area. Two methods were used to analyze and compare the detection limit, sampling volume, detection time, determination results, recovery rate and precision of the two methods. Results The paired t test was carried out on the results of the two methods for 30 water samples, t=1.070, t0.05(29)=2.045, t<t0.05(29), P>0.05, no difference Statistical significance. The recovery rate measured by the micro-processing Ion Meter method is 99% to 100%, and the recovery rate measured by the ion chromatography method is 100% to 103%. The standard deviation measured by the micro-processing Ion Meter method is 0.005-0.008, and the relative standard deviation is 0.33%-1.39%. The standard deviation measured by ion chromatography was 0.006-0.010, and the relative standard deviation was 0.66%-2.16%. Conclusion Both determination methods can obtain good accuracy and precision.
Drinking water endemic fluorosis is an endemic disease with wide distribution and serious harm. The appropriate concentration of fluorine in drinking water is 0.5-1.0mg/L. Long-term drinking of water with a fluoride content higher than 1.0-1.5 mg/L is prone to dental plaque, and when the fluorine content in water is higher than 4 mg/L, it can lead to bone fluorosis. Therefore, it is of great significance to carry out and continuously improve the detection of fluoride in water. The detection methods of fluoride in water are currently more commonly used ion selective electrode method and ion chromatography. The purpose of this experiment is to compare the similarities and differences of the two methods for the determination of fluoride in drinking water.
1 Materials and methods
1.1 Reagent fluoride standard substance; ionic strength buffer II [1] (for the preparation method, see the Ministry of Health's "Drinking Water Inspection Specification"; ultrapure water. 1.2 Instruments
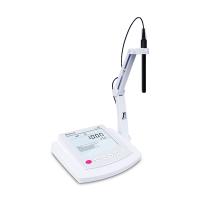
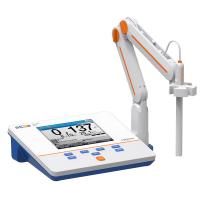
1.2.1 Microprocessing Ion Meter method DJL-3 microprocessing Ion Meter, CSB-F-1 fluoride ion selective electrode (Chunhua brand), 232 saturated calomel electrode (Chunhua brand).
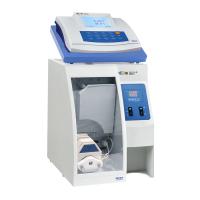
1.2.2 Ion chromatography ICS-2000 ion chromatograph; EGCⅡKOH eluent automatic generator, DionexIonpacAS19 analysis column, DS6 thermal conductivity Detector, ASRS300 anion suppressor, chameleon analysis software; UPW-50S ultrapure decanter.
1.3 Chromatographic conditions The flow rate is 1.00ml/min, and the injection volume is 25μl.
1.4 Experimental analysis steps
1.4.1 Determination of fluoride content in water by micro-processing Ion Meter method Take 6 standard solutions of different volumes in 50ml beakers, add pure water to 10.0ml each. Add 10.0 ml of ionic strength buffer II. Determine the potential value of the standard series solution, take the logarithm of the fluoride activity (lgаF-) as the independent variable, and the potential value E (-mV) as the dependent variable, draw a standard curve, or calculate the relevant regression equation. Take 10.0ml of water sample in a 50ml beaker, add 10.0ml of ionic strength buffer II each, put in a magnetic core stirring bar and stir. Insert a fluoride ion electrode and a calomel electrode, and read the equilibrium potential value dynamically under stirring. Read on the standard curve or calculate the concentration of fluoride in the water sample from the regression equation.
1.4.2 Determination of fluoride content by ion chromatography Filter the water sample through a 0.20 μm microporous membrane to remove suspended particles, pass the standard solution and water sample into the ion chromatograph for detection through an automatic sampler, record the peak height or Peak area. The fluoride concentration in the water sample is directly calculated by the chromatographic workstation software.
2 Results and Discussion
2.1 Comparison of the lower detection limit of the two methods Determination of the lower detection limit of the ion chromatography method: 20 consecutive injections of the low-concentration standard solution [ρ(F-) = 0.020 mg/L], the concentration corresponding to 3 times the standard deviation obtained The lower limit of qualitative detection is 0.006 mg/L; 10 times the standard deviation is the lower limit of quantitative detection, the lower limit of quantitative detection is 0.016 mg/L, and the lower limit of quantitative detection after integration is 0.01 mg/L. 020mg/L. If a more sensitive instrument is used or the injection volume is increased, the lower limit of detection is expected to be lower. The minimum detection quality of micro-processing Ion Meter method is 2μg, take 10.0ml water sample, the minimum detection quality concentration is 0.2mg/L [1]. Therefore, for water samples with a fluoride content of less than 0.2mg/L, ion chromatography can only be used for analysis to ensure the accuracy of the test results.
2.2 Comparison of sampling volume and detection time of the two methods The injection volume of the ion chromatography method is about 25μl, the actual loading is about 5ml, and the sampling volume of the micro-processing Ion Meter method is 10.0ml. Both the ion chromatography and the micro-processing Ion Meter need to be preheated for about 30 minutes. The time required for the ion chromatography to measure a sample is about 15 minutes, and the time required for the micro-processing Ion Meter to measure a sample is about 5 minutes. Although the determination of ion chromatography takes a long time, it can analyze the content of F-, Cl-, NO3-, SO42- plasma at the same time.
2.3 Comparison of the measurement results of the two methods A total of 30 samples of groundwater and surface water were collected in Xuzhou area. The 30 samples were analyzed by micro-processing Ion Meter and ion chromatography respectively. The results are shown in Table 1.
3 Conclusion
According to the above analysis and comparison, when the fluoride content is lower than 0.2mg/L in the water sample, the micro-processing Ion Meter method cannot be measured. Better accuracy and precision can be obtained. The micro-processing Ion Meter method takes less time than the ion chromatography method, but the micro-processing Ion Meter method can only measure the content of fluoride in water, and the ion chromatography method can simultaneously analyze F - , Cl - , NO3 - , SO42 - plasma in water content, and the amount of sample required is small, which greatly reduces the workload and improves work efficiency. However, ion chromatography is expensive and popular. Using ion chromatography to determine the content of fluoride in drinking water in a qualified laboratory can save personnel, time and reagents, and can also perform quantitative analysis on other ions at the same time.


- 1Conductivity Meter and Ion Meter specific differences
- 2Flame photometer and ionometer
- 3Bante321 series Ion meter series selection table [selection]
- 4PH211 pH Ion meter operating instructions
- 5410P-13 Benchtop Fluorine Ion meter Operating instructions
- 6D10P-06 Desktop Sodium Ion Meter Manual
- 7UTE Handheld PH_ Ion meter Description
- 8420P-01 Portable PH_ Ion meter Description
- 9Thermo Fly D10P-01 Dual Channel PH_ Ion meter Manual
-
![Bante931-NH4 Laboratory Ion Meter Ammonium Ion concentration Detector]()
-
![Bante30 portable Ion Meter electrode]() Bante30 portable Ion Meter electrode$ 815.00
Bante30 portable Ion Meter electrode$ 815.00 -
![LEICI PXSJ-216F laboratory Ion Meter 0.001pX multiparameter Ion concentration detection]()
-
![LEICI DWS-51 sodium Ion Meter measurement pNa/Na + concentration value 0.00~9.00pNa]()
-
![LEICI DWS-296 Ammonia nitrogen analyzer Ion Meter test ammonia nitrogen concentration value]()
-
![Bante931-Cd Laboratory Ion Meter Cadmium Ion concentration Detector]()