Relationship between water-based ink dispersion and hiding power
"Study on Dispersion and Hiding Power of White Water-based Ink"
Gong Ying, Wei Xianfu, Guo Changlong, Huang Beiqing
(Beijing Institute of Graphic Communication, Beijing 102600, CHINA)
Abstract:
In printing, white ink is usually used as a primer ink, white inkCoverageIt plays a key role in the reproduction of surface graphics and texts. Ink dispersion is one of the important factors affecting its hiding power. In order to explore the relationship between ink dispersion and hiding power, white water-based ink samples with different dispersions were prepared by changing the ink preparation process. The particle size and dispersion state of the ink were tested, and the ink was coated on the hiding power test paper to test the hiding power and the surface morphology of the ink film, and the effect of the dispersion of white water-based ink on the hiding power was analyzed. The experimental results show that the ink pigment particles with good dispersion are evenly dispersed, there is no agglomeration, and the hiding power is good. The opposite is worse.
Key words: water-based ink; Dispersibility; Coverage
CLC Number: TS802. 3 Bibliographic Identifier Code: A
Article Number: 1004-8626(2014)06-0010-03
Water-based inks are especially suitable for packaging and printing products with strict hygienic conditions such as cigarettes, wine, food, beverages, and medicines, and are of great significance to food safety [1-4]. White ink is a commonly used ink in packaging printing, which is mainly used to make a base ink and plays a key role in the reproduction of surface graphics [5-7]. Therefore, hiding power is important for white inks
Performance.
The opacity of an ink essentially depends on the ratio of the refractive index of the pigment to the refractive index of the binder. When this ratio is 1, the pigment is transparent; If the ratio is greater than 1, the pigment is opaque, i.e. it has hiding power. The refractive index of the pigment is affected by the dispersion of the pigment and the difference between the refractive index of the pigment and the binder [8-9]. Ink dispersion has a great influence on its hiding power, so it is of great significance to study the effect of ink dispersion on its hiding power.
1 Experiments
1. 1 Experimental materials
Pigments: TiO₂ p; Grinding resin: resin; Film-forming resin: CM1; Dispersants: 750, 760; Defoamer: 810; Solvent: deionized water.
1. 2 Experimental equipment
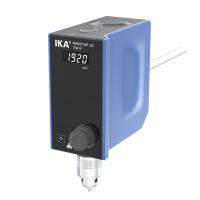
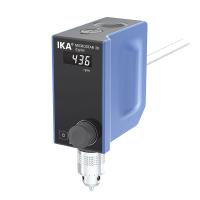
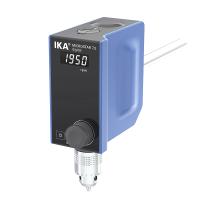
D2004W Electric Mixer (Shanghai Sealer Instrument Co., Ltd.), IGT-2S High Speed Stirring Disperser (Shanghai Saaler Instrument Co., Ltd.), Microtrac S3500 Laser Particle Size Analyzer (Micro-trac S3500, USA), Ref. 310 Hiding Force Tester, X-528 Spectrodensitometer (X-Rite), K101 Motorized Coater (Onkel Co., Ltd.), Field Emission Scanning Electron Microscope (FE-SEM, Hitachi).
1. 3 Sample preparation
According to the formulated ink formula, the pigments, solvents, binders and additives required for the ink are weighed according to the quality, put them into a beaker, and pre-disperse them with a blender (the pre-dispersion time is 30min). The pre-dispersed ink is placed in a high-speed sander for grinding, and the grinding time is 0. 5h、 1. 0h、 1. 5h、 2h。 Put the prepared base ink into the dilute resin, and then stir with an electric mixer for 30min. The particle size (d) distribution of the four groups of A, B, C, and D prepared using different preparation processes is shown in Figure 1.
1. 4 Performance Testing
1) Dispersion test.
The particle size of the ink was measured by the S3500 laser particle size analyzer with deionized water as the diluent, and the dispersion of the ink was represented by the particle size distribution map, the narrower the ink particle distribution in the distribution map, the smaller the particle size value of 95%, and the better the ink dispersion. Conversely, the wider the distribution of ink particles, the larger the particle size of 95%, and the worse the ink dispersion.
2) Hiding power test.
The ink was applied to the opacity test paper, and the black density value of the black block white ink film on the opacity test paper was measured, which could be used to represent the hiding power of the white ink, the larger the density value, the worse the hiding power. The opposite is better.
3) Surface topography test.
Field emission scanning electron microscopy (FE-SEM) with a magnification of 20,000 times was used to observe the surface of the ink film.
2 Results and Analysis
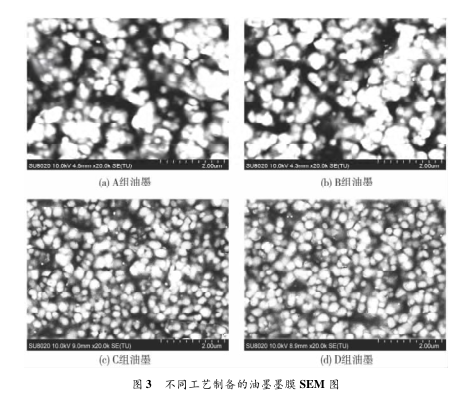
Four kinds of inks with different dispersion prepared by different processes were coated on the hiding power test paper to test their respective hiding power, and the results showed that the hiding power of the inks with different dispersion was different. It can be seen that the dispersion state of the four groups of inks A, B, C, and D is different. The pigment particle size distribution range of group A ink was the largest, the dispersion effect was the worst, the dispersion was uneven, and the hiding power of the prepared ink was the worst. The particle size distribution range of the ink pigments in group B was larger, the dispersion effect was poor, and the ink hiding power was also poor. The particle size distribution range of the ink pigments in group C was smaller, the dispersion effect was better, and the ink hiding power was better. The particle size distribution range of the pigment pigment in group D was the smallest, the dispersion effect was better, the dispersion was more uniform, and the ink hiding power was better. As can be seen from Figure 2, as the ink dispersion effect gradually improves, the ink hiding power also gradually improves, and when the ink dispersion reaches a certain level, the ink hiding power does not change much. In order to verify the relationship between ink dispersion and opacity, four groups of ink films were magnified by SEM 20,000 times, and the results showed that the white part was white pigment particles and the black part was the substrate. Figure 3(a) and 3(b) are the surface topography of the ink film for Group A and Group B inks, respectively. It can be seen that the pigment particles of group A ink and group B ink are different in size, uneven dispersion, and obvious agglomeration, which makes the surface of the ink film expose a large area of the substrate, resulting in poor ink hiding power. Compared with group A inks, group B inks have less agglomeration and less exposed substrate area than group A inks. It can also be seen from Figure 1 that the ink in group B has a narrower particle size distribution range than the ink in group A, with better dispersion and better hiding power. Figures 3(c) and 3(d) are the surface topography of the ink films of Group C and Group D inks, respectively. As can be seen from Fig. 3 (c) and Fig. 3 (d), the pigment particle size of the C and D ink is relatively uniform, and there is almost no agglomeration. Combined with Fig. 1 (c) and Fig. 1 (d), it can be seen that the particle size distribution range of group C ink and group D ink is small, the ink dispersion is good, evenly dispersed, the area of the exposed substrate is relatively dispersed, and the ink hiding power is better. Comparatively speaking, the pigment particle size and dispersion uniformity of group D inks are better than those of group C inks, so group D inks have good hiding power.
3 Conclusion
In short, the better the ink dispersion effect, the smaller the particle size distribution range, the more uniform the pigment particle size, the no agglomeration on the surface of the ink film, and the less exposed substrate, the better the ink hiding power. On the contrary, the ink dispersion effect is poor, the particle size distribution range is large, the pigment particle size is uneven, the surface agglomeration of the ink film is serious, the exposed substrate area is large, and the ink hiding power is also poor.


- 1Summary of determination methods for hiding power of coatings
- 2Pigment hiding power
- 3Determination of Coating hiding power
- 4GB/T 23981.2-2023: Paints and varnishes - Determination of hiding power - Part 2: Checkerboard method - Interpretation
- 5Concept, influencing factors and determination method of Coating hiding power
- 6Mayer Rods: The right-hand man for hiding power tests
- 7Coating performance testing: ensuring the efficiency and mass of the painting process
- 8Coating hiding power measurement
- 9Application of paint film Applicator in hiding power test
-
![Leneta Form 2DX Opacity Chart Leneta popular model sealed cardboard Drawdown Sheet]()
-
![Leneta WB sealed film, pure white]() Leneta WB sealed film, pure white$ 298.00
Leneta WB sealed film, pure white$ 298.00 -
![Leneta 5DX sealed Opacity Chart black and white in half, top white and bottom black]()
-
![Leneta Form 2C Opacity Chart]() Leneta Form 2C Opacity Chart$ 306.00
Leneta Form 2C Opacity Chart$ 306.00 -
![Leneta Form10B sealed Opacity Chart black and white check chart]()
-
![Leneta Form 7B sagging and levelling test cardboard 194 x 289 mm 250 sheets/box]()