The coating properties are related to the profile height of the steel surface. There are three devices that can be used to measure this surface profile: replica tape, depth micrometer with tip probe, and stylus roughness Tester. In this paper, the measurement results of three measurement methods of steel by various explosive media in recent years are introduced, and a new depth micrometer measurement method is proposed, namely the maximum peak average method.
illustrate
Steel surfaces are often cleaned by abrasive impact before the application of protective coatings. This process eliminates previous paints and rough surfaces, improving the adhesion of the coating. The resulting surface profile, or fixed pattern, is made up of a complex pattern of peaks and valleys that need to be accurately evaluated to ensure compliance with job or contract specifications.
There are several test methods for the specialty of protective coatings that can be used to determine the amount of surface profile. Small pieces of information can help them choose a tool or compare the results of different methods.
Measurement method
The peaks and troughs after rust removal are not easy to characterize random uneven steel surfaces. Highly precise instruments that can measure profiles, such as scanning electron microscopes, are only suitable for laboratory use. The method of the field is desirable. The surface profile range is usually specified and the recommended surface profile is suitable for a variety of different coatings.
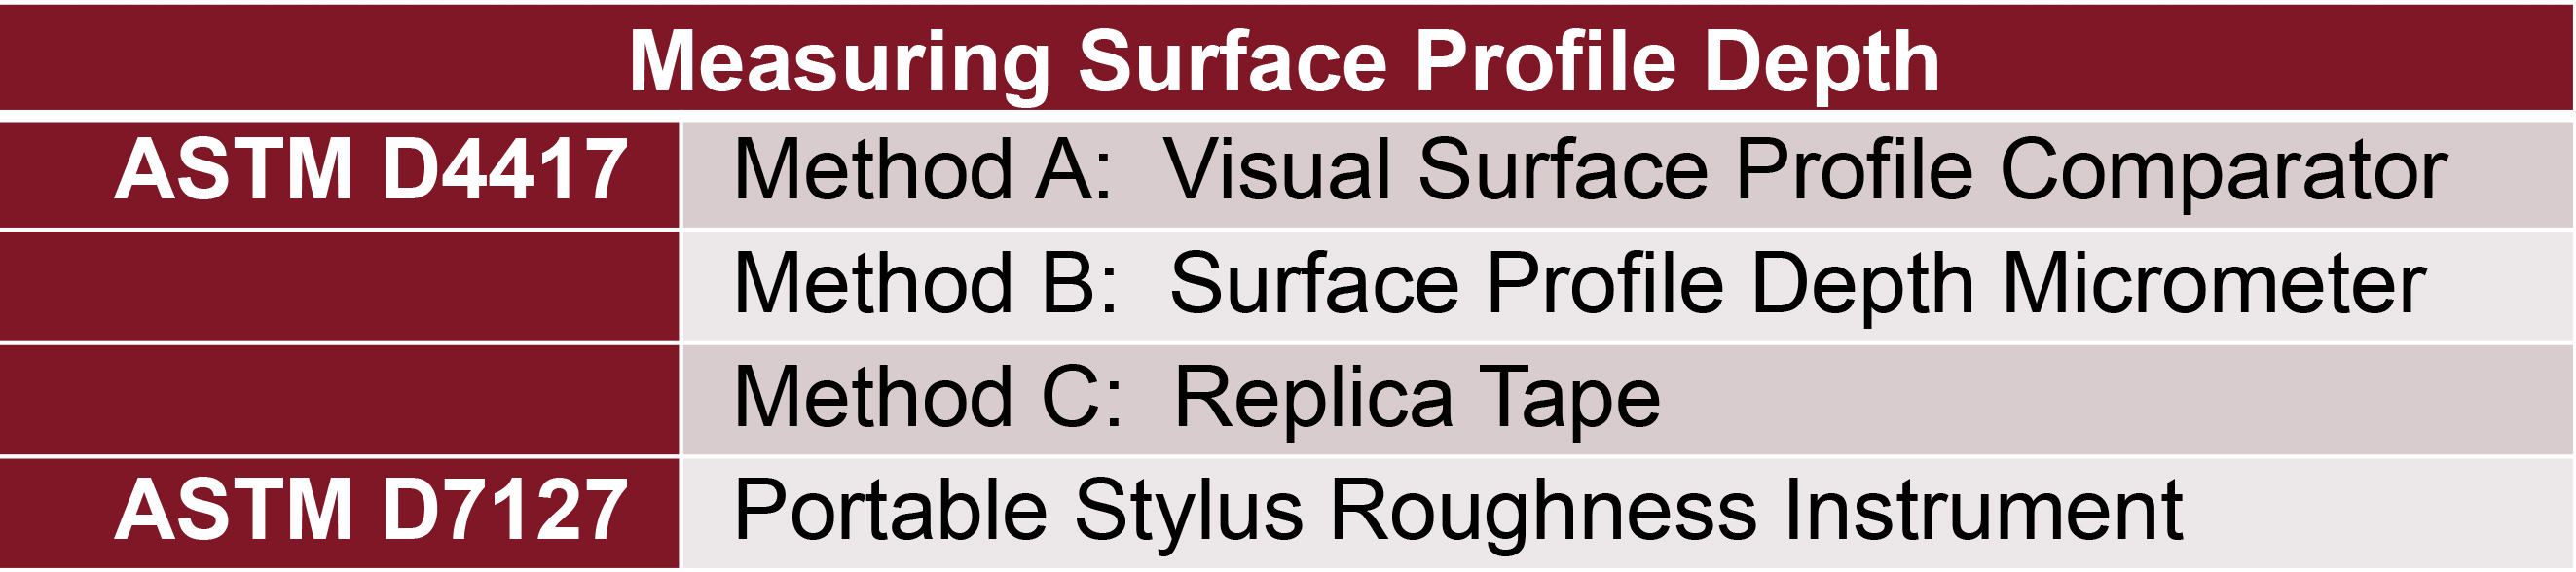
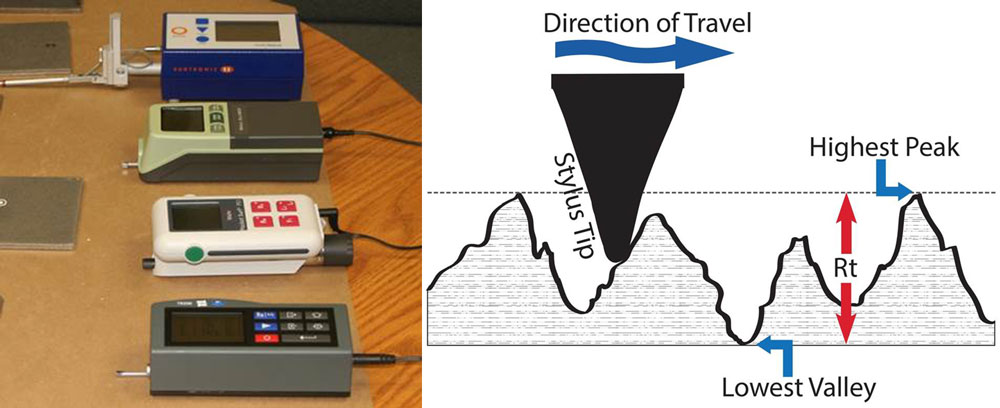
The determination of the surface profile depends on its definition. International Organization for StandardizationOne8503-1TwoIt is defined as the height of the main peak relative to the Grand Canyon. ASTMThreed7127FourIt is introduced that the positive and negative vertical deviations are measured from the average line, and the approximate profile is evaluated center. ASTM d4417-11FiveNo profile is currently defined, but 3 different measurement methods are described (A-profile comparator, B-Depth micron, and C-replica tape).
Fig.1. Measurement method of ASTM surface profile
The industry is not worth tracing back to the National Institute of Metrology has configuration standards. If they do, the instrument can validate these standards, accuracy reports can be issued, and users will have their results as a means. The criterion can determine the value relationship obtained from the depth micrometer of the replica tape, and so on.
There is no material standard, and the industry chooses the method of adjudication. NACESix, ASTM and ISO describe the distance of the surface profile height from the lowest valley base of the field of view of an optical microscope measured from the highest peak. The microscope is focused on the field of view of the highest peak. The distance of the lens to the lowest point within the same field of view is a single profile to measure the height. 20 arithmetic mean of the average maximum peak-to-valley values of the measurements. In other words, the average of the maximum peaks.
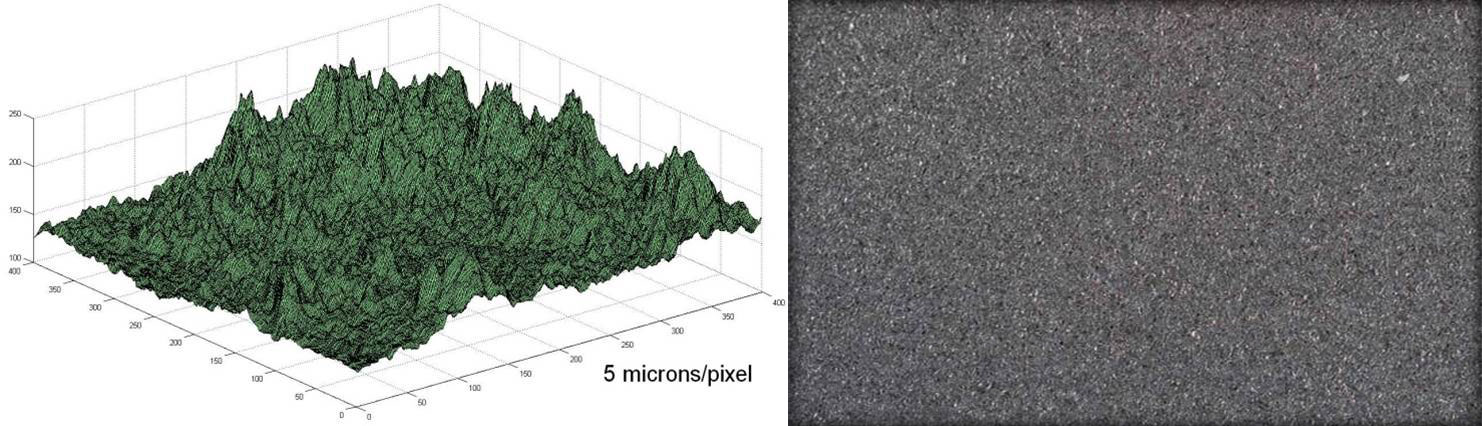
Figure 2: Computer-generated image of sandblasted steel surface (left). A fried noodle (right).
The microscope method is impractical, so the main organization supports many other methods that are practical and often used by inspectors.
ISO made surface profile comparator steel sandblasted cleaned granules abrasives7 is a microscope-based focusing method. Using visual or tactile means, the user compares the surface of the steel with each part of the profile to apply the appropriate rating "fine", "moderate" or "rough". ISO 8503-5 Annex B shows that these comparators correlate well with method measurements for duplicating tapes and pens. There is no ISO method for depth micrometers, and depth micrometers should not be used to measure the profile of the comparator because the comparator lacks flatness.
NACE rp0287 also shows8 replicated tapes and confocal microscopy measurements agreed at their confidence limits (two standard deviations)11 to 14 cases.
Replica tape
Replica tapes are simple, relatively inexpensive, and correlate well with focused microscopy results. Not surprisingly, it could become a very popular field method for measuring surface profiles.
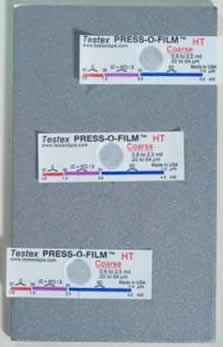
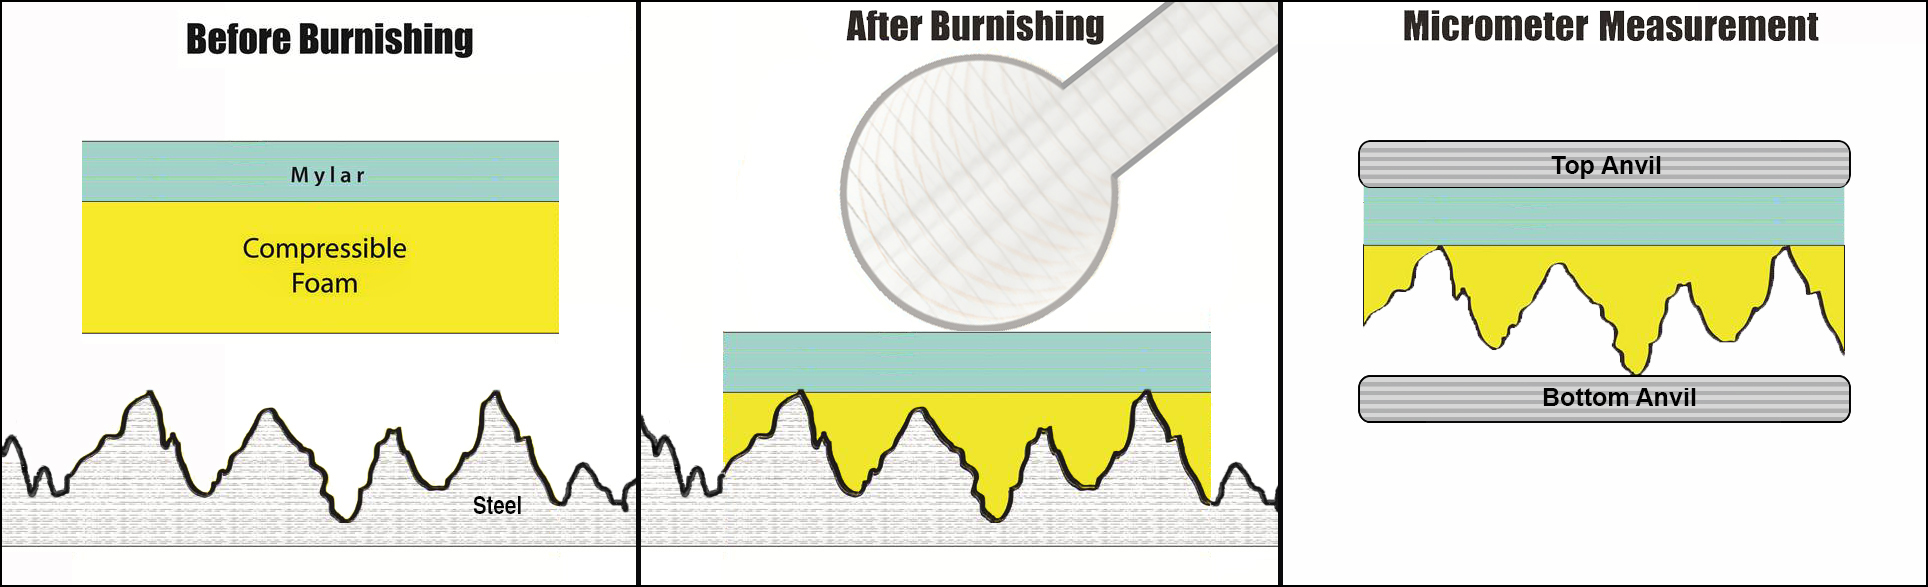
The replica tape consists of a layer of compressible foam pasted on a non-compressible polyester substrate of uniform thickness (2 ml + 0.2 mils9). When pressed against a rough steel surface, the foam collapses and forms the impression of the surface. The surface profile can be measured by compressing the anvil with a micron Thickness Gauge and subtracting the contribution of the incompressible substrate between 2 ml.
Figure 3: Duplicate tape
According to ISO 8503-5 "This method measures the average maximum profile peaks and valleys", since the dial gauge anvil flattens the copy profile slightly so that the reading is equivalent to the average, although this is not a mathematical average as well. "So, we have a basic method of measuring the average of the maximum peaks.
In recent years, two other methods of profile measurement have gained popularity: a needle roughness meter (pen - ASTM D7127) and a depth micrometer (ASTM D4417 Method B). The advantages of the electronic version of these instruments reduce the impact of the operator and digitally capture and analyze measurement data.
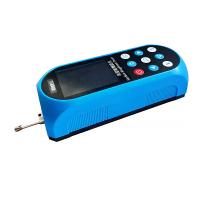
Needle roughness Tester
The portable surface roughness measuring device operates a stylus that draws a stroke on the surface at a constant speed. The instrument records the up and down distance of the stylus in which it traverses the entire surface. It measures RT in accordance with the international standard ISO 4287TenThe vertical distance of the RT is 0.5 inches between the highest and lowest valleys for any evaluation length. These traces are averaged by the RT value of five, again to obtain the average of the maximum peaks.
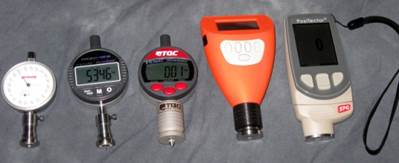
Fig. 4: Roughness instrument (the gauge shows a similar one used in this study)
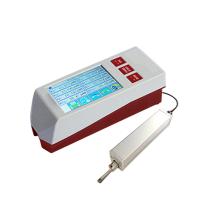
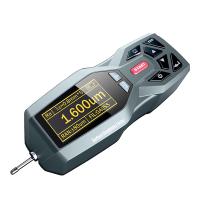
Surface profile depth micrometer
The depth micrometer instrument has a flat bottom, which stays on the surface and a spring probe that drops into the surface profile of the valley. The flat bottom is the highest peak, so the distance between each measurement is the local highest peak and a specific valley, with a projection at the tip.
Figure 5: Depth micrometer (the instrument shows something similar to that used in this study)
Currently, ASTM D4417 requires the user to measure the average depth of a micrometer no matter how low a few readings are possible. Not surprisingly, the end result is usually less than what is obtained by the voice Recorder method. This study confirms the hypothesis (Fig.). Occasionally, one of the instruments will be registered above with a resultant value, but this is an exception.
Last year, ASTM Committee d01.46 completed 11 lab rotations to evaluate the accuracy and deviation of this method for participants to measure five sandblasted steel test plates with replica tape and a three-contact stylus instrument. They opted for stylus instruments, which have enough vertical distance to be of beneficial interest to the rougher surface measurements of the coating and lining industry. Even so, in some panel profiles exceeded the measurement range of some selected instruments.
Preliminary findings confirm the conclusion of the close relationship between copying tapes and pen rough methods such as ISO. When the results are announced next year, industry professionals ± will have access to reliable and relevant data.
All that remains is a comparative study of the depth micrometer method. Providing a correlation between all three types of devices, it is proposed that the method used for depth micrometer measurements produces results similar to those of a voice Recorder that are consistent with the measurement objectives, one called "average maximum peak".
To obtain this value, the profile is positioned on a sufficient number of test surfaces, usually five. In each position, the highest reading record of ten readings. All positions of the average (average) are reported as the profile of the surface.
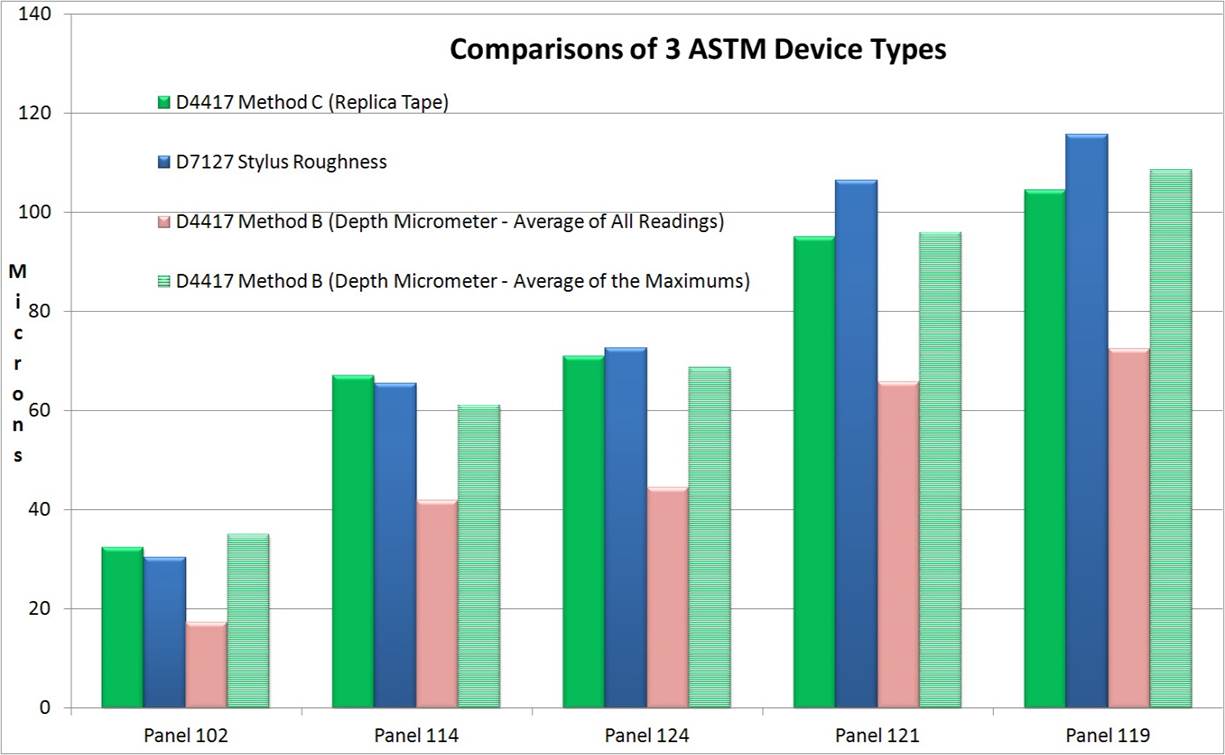
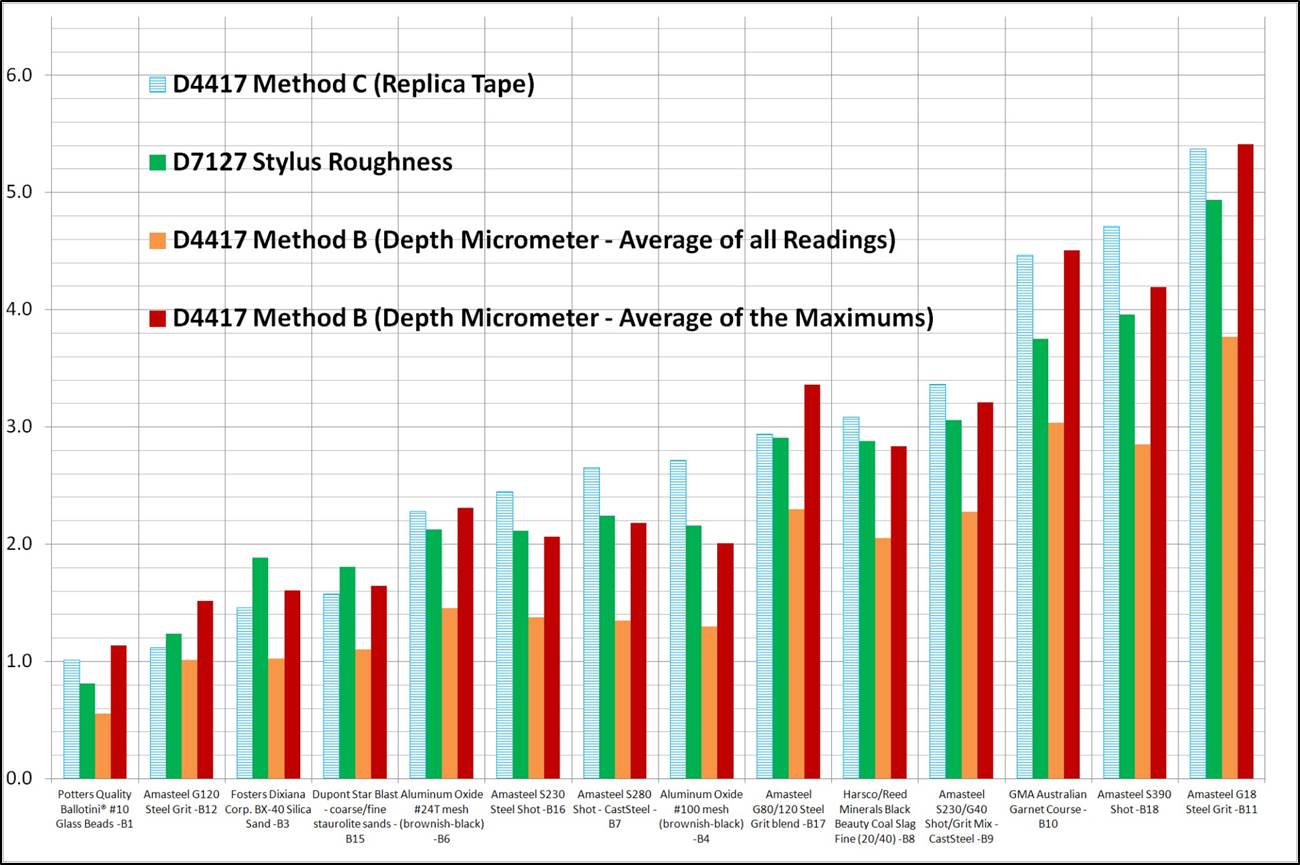
The impetus for this research came from last year's initial testing of ASTM panels with a single depth micrometer. As shown in Figure 6, when the analysis of the maximum peak method is averaged using the depth micrometer results aligned with the tape and pen results.
Preliminary results of Figure 6 5 ASTM panel
Summarize the test
To confirm these results, eicosa plates were obtained with KTA laboratories for commonly used media typesElevenFive common depth micrometers were acquired. Five people spent 50 measurements per panel per instrument in a controlled office environment for a total of 5,000 readings.
The minimum 3 replica tape measurements are averaged for each panel. When the results fall on the area outside the range of the band, the band is given a new level, with an average of additional measurements made at the manufacturer's instructions. Comparing three common field instruments yielded a needle roughness measurement. Finally, base metal readings (BMRs) were obtained from each group from Type 1 and Type 2 magnetic coating Thickness Gauges.
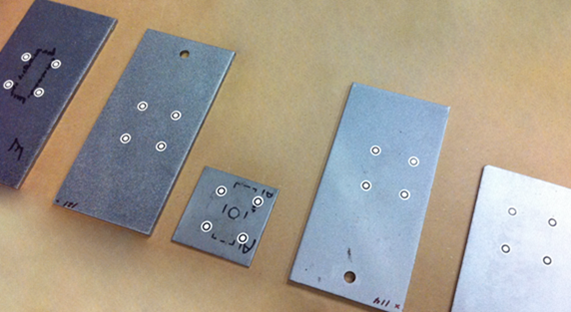
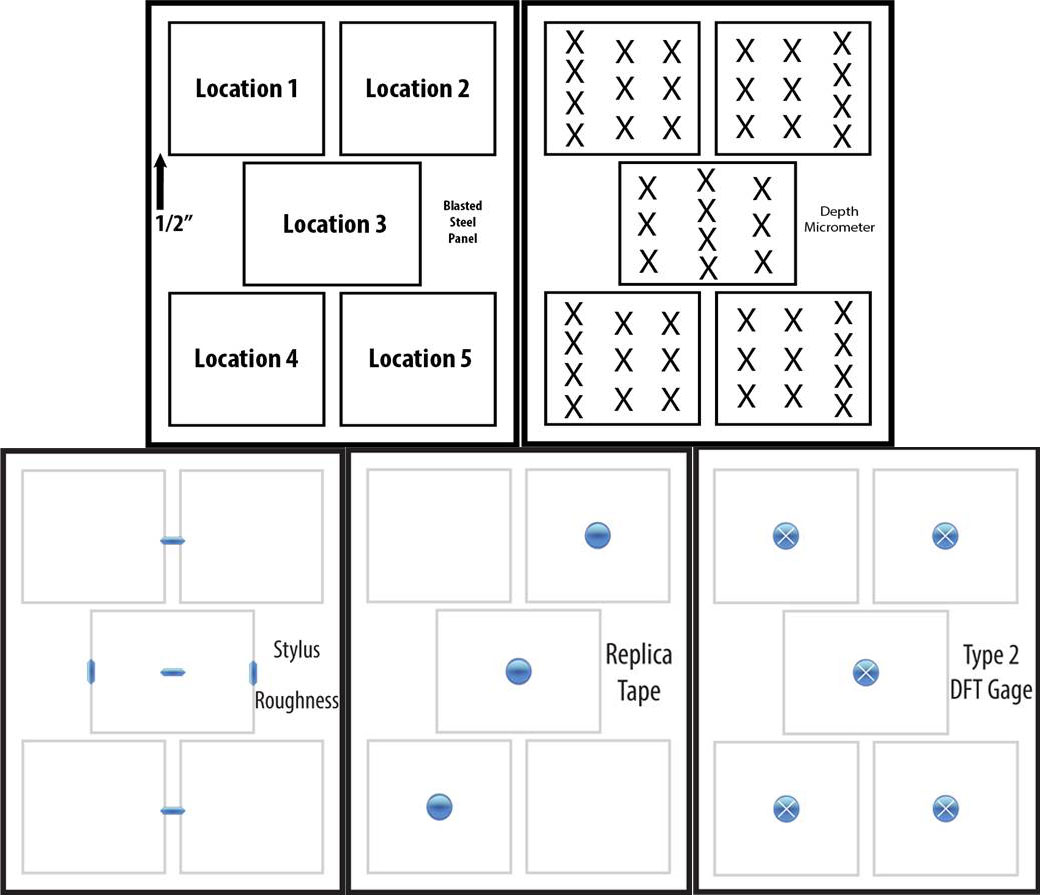
The panel measurement position for each method
DFT tool
The DFT probe measures the distance from the probe on the magnetic surface of the steel. On the magnetic surface of smooth steel with the surface of steel. The magnetic surface of the crude steel is at the highest peak, between the lowest trough in the profile, and the position may be different for the instrument type. As a result, roughness often results in a DFT instrument reading high, or positive value.
Standards such as SSPC-PA 2 require a correction factor to be applied to compensate for this roughness. Usually, a plastic gasket is placed on the bare profile and measured with a DFT meter. The gauge is adjusted so that the result matches the thickness of the shim. The gasket is adjusted to the paint surface on the peaks and ensures that the paint thickness is measured from the average level of the spectral peaks and not from the magnetic surface.
To quantify the effect on the DFT meter distribution, measure all panels Type 1 (mechanical pull) and Type 2 (electronic) devices at the first time to be zero-checked smoothly on flat bars. The average of the five measurements is recorded for each panel.
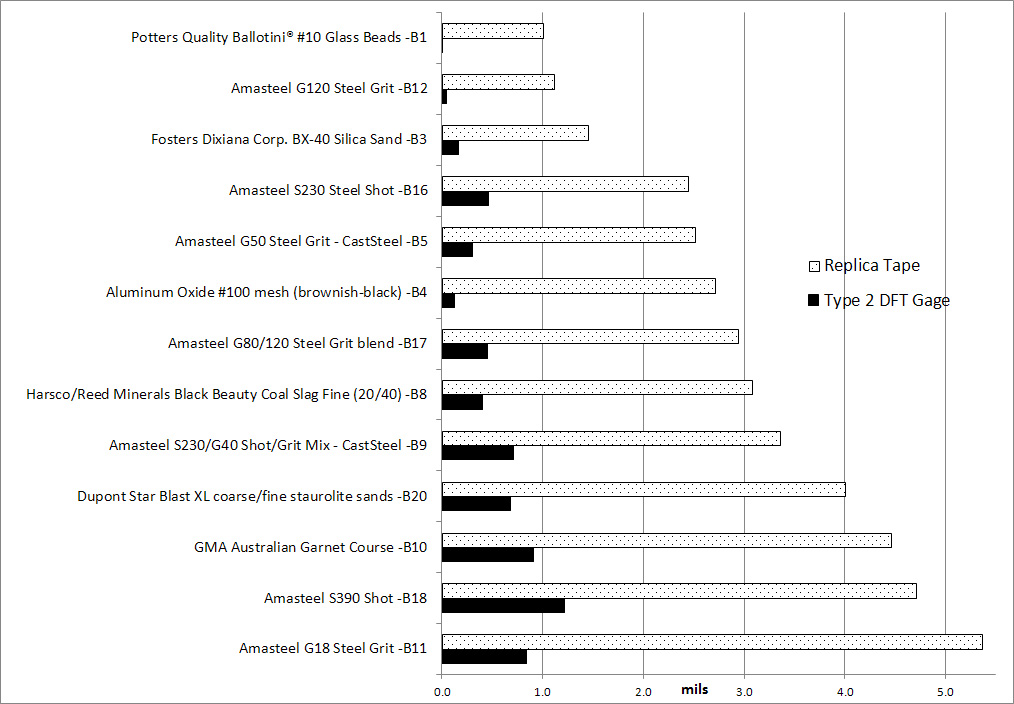
The Type 1 instrument is the measurement profile with minimal impact and a maximum of 0.3 ml on rough surfaces. The Type 2 instrument measures the sandblasted surface of glass beads between low 0 and the S390 shot blasted surface high 1.2 ml. In summary, the DFT tool gives the result of a replicate tape measurement of thickness between 1 and 26% of the surface profile height, with an average of 13% across all panels.
Figure 8 DFT meter results copied tape results
General Observation – Surface Profile Measurement
Some surface roughness exceeds the method measurement capacity of the voice Recorder. Good practice has shown that the average peak-to-valley distribution zone of commercial grade allows for measurements of 0.5 to 5 ml. All depth micrometers used in the study have an extended range suitable for measuring blasted steel surfaces and are not "maximum" on any panel.
Several groups have produced high-profile values in all instrument types. These differences may be due to the consistency of the Demoman. It can take on larger surfaces that will have similar violations.
It is not possible to test the exact position of each device on each panel (Fig.). The replica band inspection area is relatively large, so fewer measurements are required to fully characterize the surface. The stylus and depth micrometer method has a much smaller surface area of the fine-tip probe sample and therefore requires more measurements to fully characterize the surface. ISO, ASTM, NACE, and SSPC guidelines take this into account.
All methods required for initial setup and correctness verification testing begin before testing.
The method of replicating tape requires checking the micrometer accuracy for a known thickness such as a plastic gasket and dialing back a 2 ml of non-compressed plastic layer. Slight adjustments are required to compensate for micron drift in the test.
The needle roughness gauge is the most important to set up. Appropriate evaluation report length inputs, such as RPC parameters (peak) and RT (Max in evaluation of the Bog peak) are established, and the instrument needs to be placed to care for the blasted steel surface.
The depth micrometer checks the thickness of the spacer known to zero on the glass plate before and after every 50 sets of measurements. No instrument deviates from zero in the experiment.
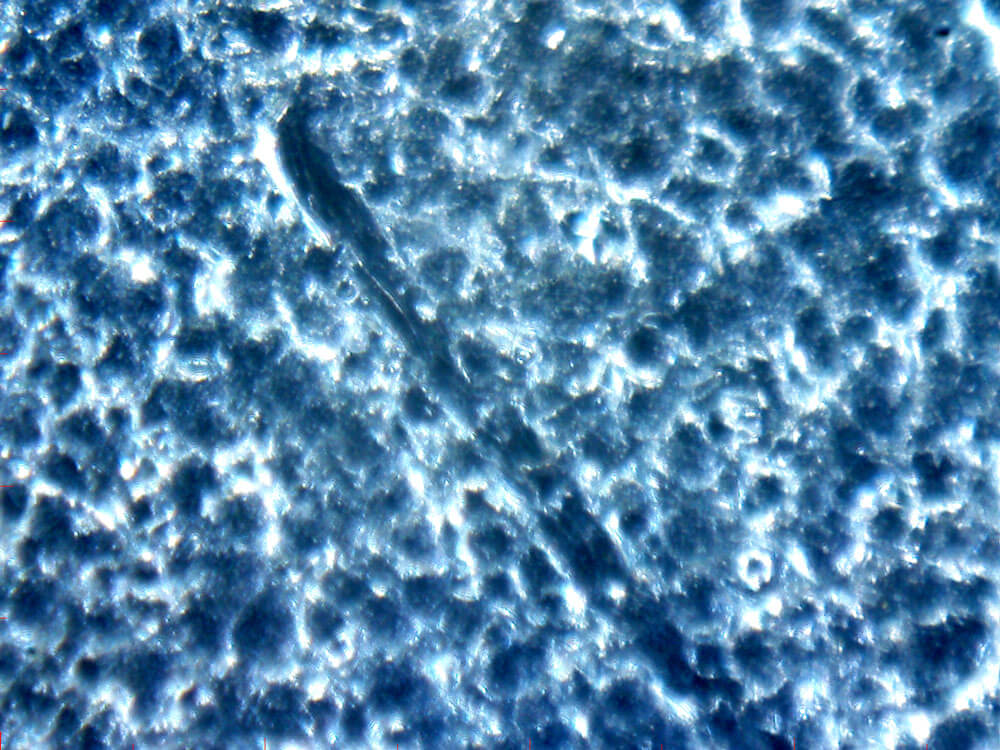
Some panels are observed after testing with replica tapes. It is believed that they are due to the fact that the microscopic particles are imprinted on the foam when it is carried away, and the foam falls off. Scratches were observed on some plates after testing with a stylus instrument. It is believed that the steel surface was slightly modified as the diamond stylus was dragged to the peak (Fig.).
A enlarged photo of 400x garnet sandblasted steel with scratches
It is clear that during the test, the results of the individual surface profile measurements are not repeatable and have greater variations than the user would expect from other forms of industrial measurements such as dry film thickness (DFT), temperature or gloss testing. While the two DFT measurements can be very close, the measurements of the two surface profiles are very different. It's a damn superficial nature.
For example, in a panel blasted with a mixture of coarse and fine stone sand, the replica tape measures a depth micrometer between 1.8~2.9 ml, a stylus instrument between 1.8 and 2.8 ml, and a depth micrometer between 0 and 5.6 ml. However, these three methods have a final "average maximum peak" of about 2.5 ml.
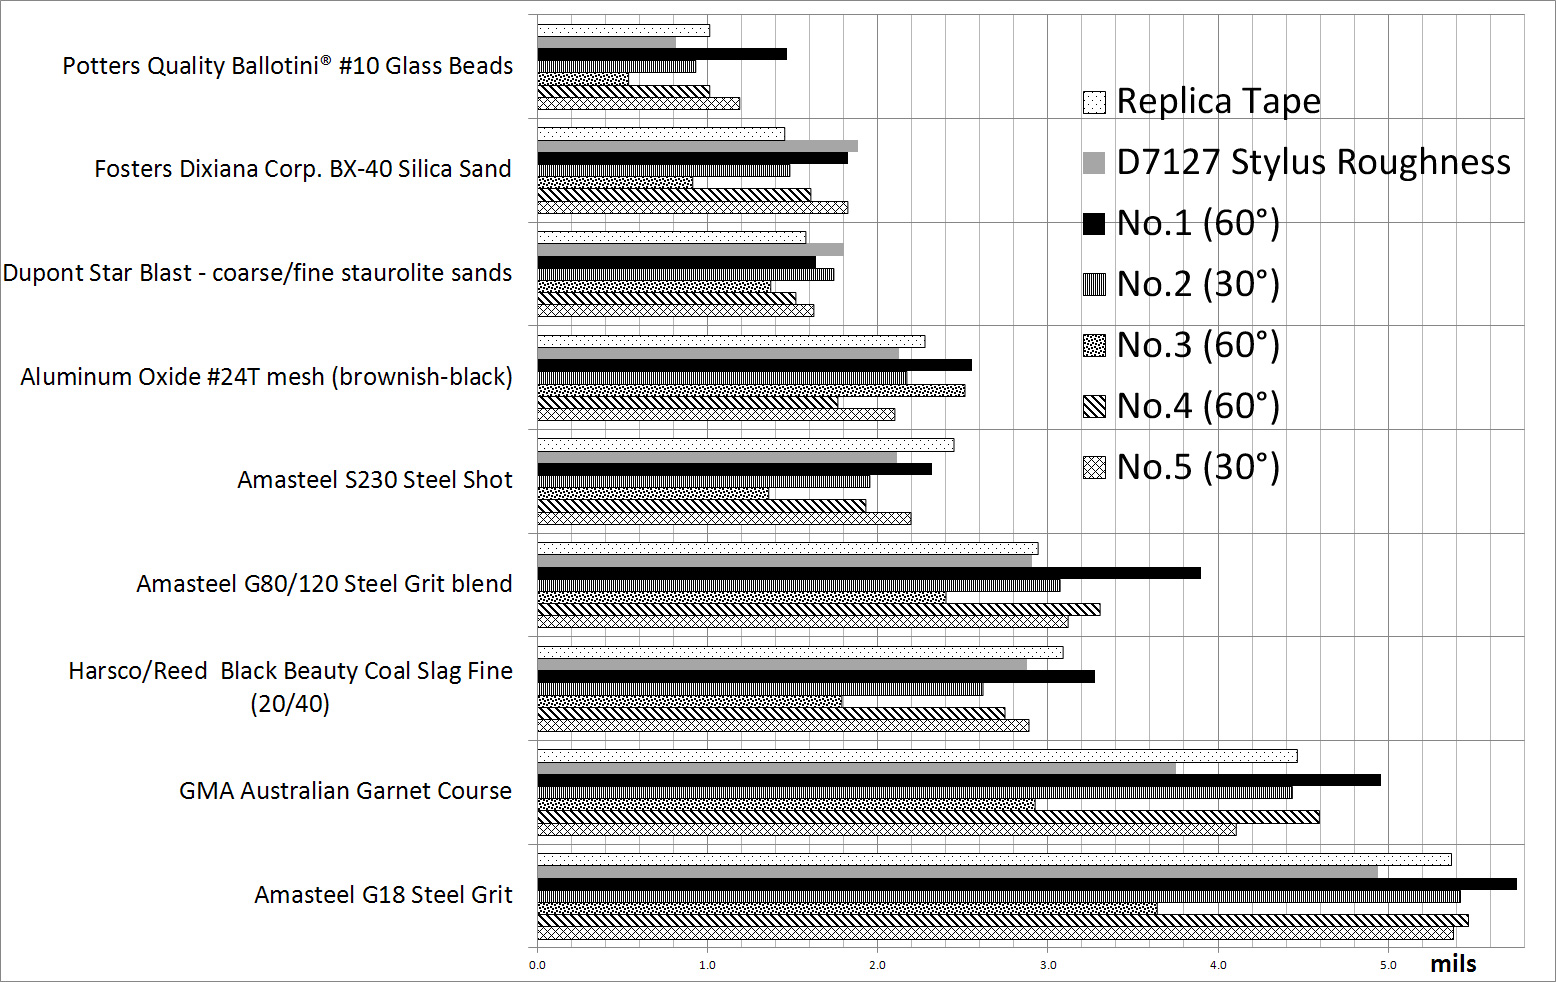
Just as often, however, the three methods yielded results that were not as close. Voice Recorder results can sometimes vary by as much as 30%. 2 panels were shot #S280 100 mesh alumina, copy tape read 2.7 mil while pen method dropped an average of 2.2 ml two. Conversely, in the BX-40 quartz sand, copy the tape to read 1.5 ml, an average of 1.9 ml higher than the stylus method. The average of the three tools was higher than the value of the duplicate tape on all 4 blast plates and all oxide and lens blast panels. See Figure 12 for a summary of the results of the copy tape with pen.
Observation – depth micrometer measurement
The following points are used to make observations when measuring the depth micrometer:
1. Loose Surface Contaminants:
Several plates produce high anomalies measured with the final no. Participant-reported tools "shocked" on the surface. This reminds them of the problem of surface contamination, so they avoid these areas.
2. Changes in readings:
There are less sand changes measured in the sandblasting board compared to the sandblasting glass beads in the plate. 250 measurements of sandblasting garnet with one instrument in a 4"X6"X1/8" panel, the result is 0.2~1.9ml. When only the average of the highest readings, the 1.2 ml result is close to the voice Recorder result.
Low readings are close to zero, occasionally recorded. They can cause a large number of peaks to push the probe in the foot plane of the instrument. Averages only the maximum values, preventing these low readings from affecting the final result.
In the case above 1.9 ml, the interest in reading is also the highest. This seems to indicate a single, deep valley, a descending probe tip, a large peak in the profile, an elevated depth micrometer foot, or surface waviness. Either way, it has only one result more, and the average gets a meaningful profile measurement.
3. Analyze the number of measurements:
Only 3 readings are in each position on the panel, and the results are not closely related to the results, indicating that the number of readings is insufficient. When positioning is performed every 5 readings, the final result is closer to the results of the tape. Increase the number of readings by 10 per position (per ASTM) to remove the obvious randomness of the results and provide the most relevant tape and pen methods. More measurements did not improve the results.The overall results of the reduction in the number of locations from 5 to 3 were not significant. This shows that the characteristics of at least 10 readings at 3 locations make the profile surface adequate.
4. Difference between the results of the depth micrometer:
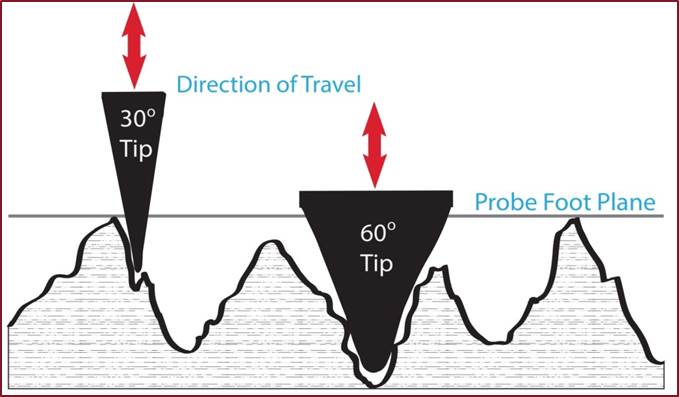
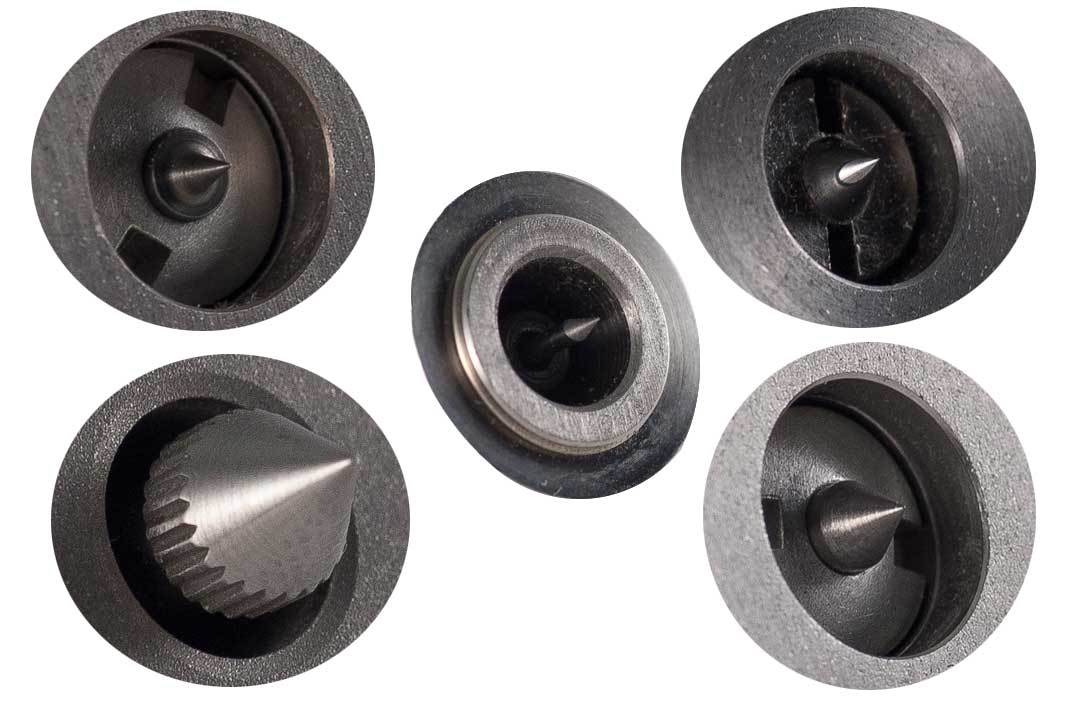
The depth micrometer used in this study is a machined probe with 30° and 60° angles. Their spring pressures are between 70 and 125g force, respectively. Instruments with a 30° probe tend to produce lower results than those with a 60° probe. Instruments with weak probe forces generally produce lower results than those with strong probe forces. This indicates that the probe angle and probe tip force affect the measurement (figure).
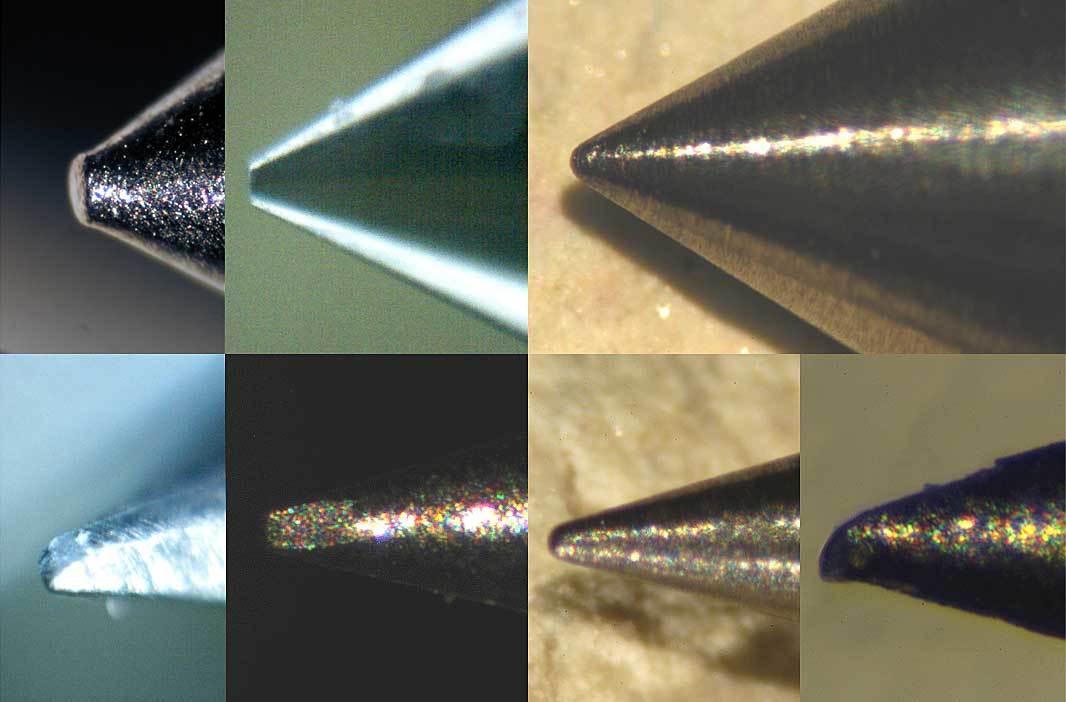
High-resolution photographs of the probe tip examined. All tips measure 30 or 60° appropriately as advertised, but their tip radius varies greatly. Some are appropriately round. Others indicate flattening or chiseling heads (figs).
Figure 10 results from the depth micrometer
FIGURE 11 HINTS OF MICROMETERS OF VARIOUS DEPTHS FOR LO AND HI RES
5. Analytical Methods:
When 50 readings are averaged per depth micrometer according to ASTM D4417, the resulting profile height measurements are almost always lower than those of a voice Recorder. Only the maximum value of each position is averaged for better results with a voice Recorder (Fig.).
Figure 12 compares the results of the measurement methods from all instrument types combined
conclusion
The results from this study confirm that there is a close relationship between voice Recorder measurements, first by last year's ASTM cycle test. The results of the survey also showed interesting information about the type of measuring device for the third time, the depth of the surface profile, the results achieved with the Recorder when the "maximum peak" analysis method was averaged (Fig.
The damn steel at any point on the surface is randomly varied, so some reading needs to be taken. The purpose of the assessment is to enable the determination of the maximum peak-to-valley value. Blasting on abrasives to clean metal surfaces individually and measure different areas on a given surface. These measurements, combined, depend on the maximum value of the parameters required for the trough height, the average peak, or something else. Using the "average maximum peak" analysis method, the depth micrometer closely replicates the tape and pen roughness meter test results for reliable surface profile measurements.
cite
International Organization for Standardization (ISO), 1 rue de varembé post, case 56, CH-1211, Geneva 20, Swiss ±
Preparation of Steel Substrates Before Application of Coatings and Related ProductsJet Cleaning Steel Surface Roughness Characteristics - Part 1: Specifications and Definitions for ISO Surface Profile Comparators for Blast Cleaning Surface Evaluation
ASTM International 100 Barr Harbor Drive, West Conshjocken, PA 19428
d7127 ASTM Standard Test Method for Measuring Surface Roughness of Abrasives Blasting Metal Surfaces Using a Portable Electron Probe (West Conshchocken, PA: ASTM)
ASTM D4417 Standard Test Method for Measuring the Surface Profile of Steel After Sandblasting (West Schelhoken, PA:ASTM)
From the RP0287-2002 NACE standard, "Field measurement of the surface of sandblasted steel surfaces using replica tape". (Houston, TX: USA, 2002)
Preparation of steel matrix before the application of paints and related products. Surface roughness characteristics of sandblasting cleaning steel substrate. Part 2: Sandblasting cleaning steel surface profile grading method. Compare Programs
Test results of the NACE task force t-6g-19 cycle. NACE Technical Committee Report 6g176 (withdrawn). "Clean & Anchor Mode Can Clean New Steel with Centrifugal Blasting" (Houston, TX: NACE International). (Available as a historical document from NACE International.) )
This statistical summary was conducted using Imperial units. To convert to metric units, use 1 mil = 25.4 μm(μm).
ISO 4287:1997 Product Geometric-Technical Specification (GPS) Method, definition, and surface parameters for surface structure profiles
KTA Commutator, Inc. (KTA), 115 Technology Drive, Pittsburgh, PA 15275 USA.