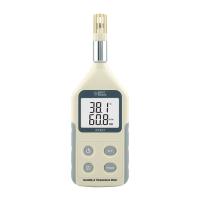
Small climate monitoring-U23-001 outdoor temperature and humidity Recorder
Pacific Geographic Data (PGD) provides geographic information system (GIS) mapping and analysis services to vineyards, wineries, public agencies, and other institutions in the United States and abroad.
Matt Lamborn, owner of Howell Mountain, PGD and manager of his family's vineyards (Napa Valley's first appellation), combines his management knowledge of vineyards and GIS mapping and analysis to provide these to others in the wine industry Serve. In particular, PGD provides climate monitoring services to its vineyard and winery clients, helping them understand the potential for frost and other growing conditions in their respective vineyards
As part of a typical microclimate study, temperature and relative humidity levels were recorded using PGDOnset's HOBO data logger U23-001. In one particular project, a total of 21 HOBO data loggers were deployed for a vineyard development study in rural Napa County. Data logger U23-001 was placed on a grid plan (but not yet planted) at a Napa Valley vineyard with two main objectives: 1) to determine the extent of frost stress in rolling terrain; 2) to determine the extent or growing degree days ( GDD) values in performance and throughout the growing season.
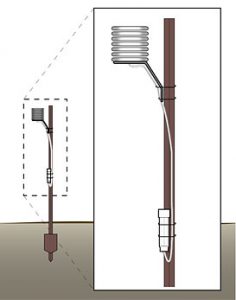
The data logger is mounted on the 6 foot "T" using two large zip tie posts. The logger housing is fitted with cables and the communication window is pointing downwards. This configuration, with additional slack on the top zipper, allows for easy unloading using the Onset Data Shuttle U-DT-1, BASE-U-4. The shuttle is a handheld device, sold in a laptop computer, that stores data on location and transport records. All sensors are placed on gill plated shields (see illustration below for details).
In areas with high tractor and equipment operations, prepare a PVC enclosure for PGD protection of the data collector U23-001. The enclosure consists of 2" long 8" diameter PVC tubing with a fixed cover at one end and a sliding cover at the other end. PGD personnel drilled the securing cover, threaded the sensor and wires through, and installed the case RS1, U23-RS-CLAMPKIT after the T with an oversized zip tie. To unload the data loggers, they simply slide the cover and log a few inches, connecting the data shuttle.
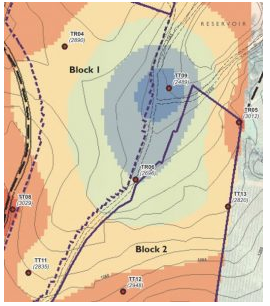
The reference picture (Figure 1) is a layout drawing. Red dots indicate the location of the HOBO data logger ("TR" for temperature/RH and "TT" for channel temperature units, followed by the ID number). Below the HOBO label of the quantity is the actual growing degree day (GDD), the value of the sampling point. The color gradation in the figure is the GDD value range. They build the GIS at the site by interpolating GDD values at each sampling point.
Measurements are taken every 15 minutes and data is unloaded every 4 to 6 weeks and checked quickly to ensure data integrity. Onset's hoboware® Pro graphing and analysis software package is performed after each inspection of the data is uninstalled, at which point PGD looks for anomalies or interesting trends that they may want to adjust for the study period. The data are further analyzed and prepared for use in GIS using Microsoft.
Combining hoboware, Microsoft Excel, and GIS, PGD came up with two main climate plans for calculating each data point in the vineyard: 1) the number of frost hours, and 2) the number of growing degree days. Frost hours are counted as the total number of hours that the temperature stays below 36ºF during a typical growing season. The 36ºF threshold method is because at this site the vineyard manager will usually turn on the frost protection system. GDD values calculated using the averaging method, with 50ºF being the lower temperature threshold
Data is used by clients of PGD for three main purposes. First, in general, data is used to simply identify and map cooler and hotter areas of a site. Two, the data help identify areas that receive the frostiest hours during the growing season. Frost information is very important because groundwater scarcity is a serious problem in many areas of Napa County. Identifying the most frost-prone areas allows the vineyard manager to prioritize where frost sprinklers should be installed (i.e. in the coolest areas) and where possible fans should not be used (i.e. the most frost-prone areas). Using this information can significantly reduce infrastructure costs for wineries (ie digging trenches and installing additional irrigation systems for sprinkler systems). Finally, the GDD value was used to determine which wine grape variety and rootstock/clone combination would be more suitable for the site's climate. For more information, contact Beijing North Dahe Instrument Co., Ltd. In theory, using this information, together with slope, aspect, and soil maps of the site, would allow vineyard managers and winemakers to plant vines that are most suited to the site, reducing grape stress, environmental inputs, costs, and management costs , while improving the quality of the wine as much as possible.
- 1Temperature and humidity testing in the pharmaceutical industry
- 2What are the measurement methods of temperature and humidity?
- 3蝙蝠疾病的揭秘-U12-006(UX120-006M)温湿度记录器
- 4Building EQ Evaluation - U12-012 Temperature and Humidity Light Recorder
- 5ONSETHOBO ZW Series Wireless Temperature and Humidity Recorder Wireless Monitoring of Temperature and Humidity at the National Archives in Washington
- 6Jamaican Coffee Storage U12-011
- 7Process monitoring of drying building solutions ONSETHOBO U12-011/UX100-003, UX100-011
- 8ONSETHOBO U12-012 for storage of Marilyn Monroe logo gowns
- 9Discovery of prehistoric fish UTBI-001
-
![CIMA AS817 Mini Thermohygrometer]() CIMA AS817 Mini Thermohygrometer$ 84.00
CIMA AS817 Mini Thermohygrometer$ 84.00 -
![SMART SENSOR AR837 Digital Thermohygrometer -10 ℃~ 50 ℃]()