Turbine Construction feasibility study
Presentation
Part of the Colgate University Environmental Studies Symposium entitled "Interdisciplinary Investigating Environmental Issues: Alternative Energy", a group of student geographers, economists and physicists formed a wind energy group with the overall aim of investigating Colgate's Potential to commit to a project dedicated to building a wind turbine or off Colgate land. At Wind Energy Group, our "Data Analysis and Acquisition" group is responsible for (1) acquiring professional grade anemometers, (2) assembling anemometer test sites, (3) building sites with wind speed and direction data, (4) ) modeling datasets to third-party data for the same logging segment for further analysis.
Anemometer Specifications
In our search for the right anemometer, we wanted a professional grade device that would likely require both direction and velocity data, while having data logging capabilities.
Figure 1: Our HOBO wind speed/direction smart sensor.
After researching various options, we decided to purchase the computer company's Advent HOBO wind speed, wind direction smart sensor wind speed wind speed S-WSB-M003, wind direction S-WDA-M003, S-WSET-B, S-WCA-M003, S-WCF- M003 (Figure 1). The monitoring station also accepts four sensors, which allows the possibility to purchase additional smart sensors for measuring other weather parameters or other identical wind sensors for wind analysis at multiple altitudes. Cup-based anemometers calculate instantaneous wind speed revolutions accumulated every three seconds, and log wind speeds are calculated by averaging over the specified logging interval. Orientation data are given using the vector wind direction accumulated every three seconds. Computes the vector sum of the average vector sum of the given value's dataset components over the recording interval.
Site Specific Details (Bonney Hill, Hamilton, New York)
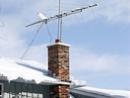
For our test site, we chose to set the anemometer on the roof of Professor Ian Helfant's home at coordinates N 42◦50 130 'W 075◦31 075', 1520 feet above sea level. These measurements are obtained using a portable GPS device. We ordered 5m (16.4ft) of welded steel pipe and the equipment itself used more and more masts. The base of the mast is obtained vertically (using metal clips) the length of the TV antenna, which has been firmly attached to the Helfant chimney of the house. Completing the assembly also required grounding equipment consisting of a length of copper wire attached to the base of the mast, running down the house, and terminating in a copper pole nailed to the ground. Wiring also runs down the house, from the sensor to the data logger, and into the house, where the sensor is permanently connected to an in-house computer. It was very suitable for our site to choose a test site since our data can be constantly checked and retrieved thanks to the computer's proximity sensor.
Figure 2: Our anemometer setup. In this picture you can see the blocking tree, which we consider in our data analysis.
After the logger information
we log at five-second intervals, we switch to ten-second intervals. Data were acquired through the onset HOBOware software logger for data management, data plotting and data analysis. HOBOware software presents data in graphical and tabular form, recording gust speed, wind speed and wind direction as wind speed S-WSB-M003, wind direction S-WDA-M003, S-WSET-A, S-WCA-M003, each recording time interval . Data can be manipulated in this program to display averages, maximums at specified time intervals, and can also be exported to an Excel file as the data can be analyzed and errors can be corrected beyond the capabilities of the software (or at least, beyond our comprehension software). The monthly data log recorded approximately 450,000 data points, which we exported to 11 total Excel files.
The constraints required for data analysis within the time constraints of a semester class, we wanted to see if anemometer data over a period of time for the next year could be reliably extrapolated with third-party data sources to estimate the annual average wind speed from the anemometer's website. In order to do this, we need to find a reliable source as close to Hamilton, NY, as possible that records at least daily average wind speeds for the past year. Very good site also has anemometers with similar terrain features on site.
Data and Analysis
Once the anemometer data is complete, run our compiled data to observe wind speeds and compare them with third-party datasets. Because of the small time interval chosen (5 seconds per point for the first log run, 10 seconds per point for the second run), we have a very large set of data points. In order to reduce the amount of data to a controllable range, we averaged increments of five minutes. The data is then averaged for daily averages (comparison with third-party data available in the interval) and overall averages. Anemometer total average of 491,867,079 miles.
Next, we considered third-party data from the Colgate University Heating Facility Anemometer and the Hamilton Weather Station by Weather Underground U30-NRC. Heating plant anemometer data are recorded as daily averages. Records extend from today (4/29/08) to about a year ago (5/1/07). At this time, we found an average of 4.5301676 miles. For Weather Underground information, we average daily data online for the time our anemometers are operating. Here we find (our program segment) an average of 0.946153846 miles.
From the comparison of these averages, a trend can be seen between the three datasets. First, the mean anemometers for heating equipment and Bonney Hill are relatively close together. To a large extent we can consider the two sites to be similar. However, when Weather compared the average underground heating unit with the average Bonney Hill anemometer, we noticed a big difference. The slower U30-NRC velocities recorded by the Weather Underground, the average is clearly due to the elevation difference, and the station is lower elevation (1134 ft) compared to the heating equipment and the Bonney Hill anemometer. Furthermore, we suspect that a large obstacle interferes with the weather of the underground station, due to the large difference in wind speed values and the overall slow wind speed recorded.
At this juncture, we next considered any obstructions that affected the Bonne Hill anemometer data points. The first known snag that we observed was a large data logger that froze at zero wind speed and gust speed. This was first observed from 3/27/08 19:51:44 - 3/28/08 10:33:09 and the anemometer cup was made to freeze.
After comparing these findings to Colgate's wind energy potential with the GIS analysis of land geographers in our group, we wanted to build anemometers on the Bewkes property, located in Lebanon's township next to Seymour Pond. In order to set up our anemometer at this new site, we needed to construct a pull tower that would stand at least 33 feet off the ground on its own (that is, without the added height provided by the Helfants' house in our first location). Also, in the desirable case, the data will be in this location. We will construct the anemometer in an open field, so obstacles will no longer be a factor in our data analysis. We are hesitant to draw any conclusions about the accuracy of the inferred mean annual wind speed from a relatively small data collection period due to the large error factor that resulted from our collection of data. Pending submission of site construction permits, the project will begin in late May to early June 2008. We did a similar analysis of a subset of the data set only after the annual data were collected on the Bix site,