Indoor environment monitoring Morse Zehnter AssociatesU12-012
How does Morse Zehnter apply portable data loggers in environmental monitoring projects?
We have entered a large school district in South Florida, with some issues related to indoor air quality (IAQ), temperature, and humidity control. In our undertaking, we have received a large number of studies on indoor air quality related complaints. It is doubtful that we initially used HOBO® data loggers to illustrate that most of the IAQ complaints were not age-based devices. These complaints stemmed primarily from issues with equipment maintenance and capacity, including excessive size and over-ventilation. We followed this detailed fitout design and followed the school ventilation design.
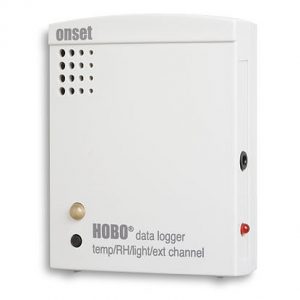
Specifically, we use five to ten HOBO®U12 series temperature/humidity Recorders U12-001(UX100-001), U12-011(UX100-003,UX100-011) U12-012,U12-013(UX100- 023) About 200 schools have done retrofit designs in the past few years based partly on ONSET data we collected. We then performed pre- and post-evaluations of ventilation rates using occupant-produced carbon dioxide (CO2) as a tracer gas and estimated ventilation rates after their decay after occupants left the space. In addition, we measured the airflow areas, which include supply, return, vent or outside air, and exhaust, as a comparison to the tracer gas analysis.
How do you monitor CO2 levels in these buildings?
HOBO® U12 Series loggers U12-012, U12-006 (new model UX20-006M) connect to a Telaire 7001 CO2 sensor to track CO2 levels, typically for a one-week monitoring period. This is part of an ongoing service contract for code compliant ventilation studies. Through careful interpretation of the data and application of the ASTM method ASHRAE 62.1 indoor air quality standard, in determining the applicable space, we were able to determine the ventilation rate produced by the decay of the occupants to the CO2 level. The data also allows us to see what time of day the CO2 level gets smaller, so we would advise when to turn off the exhaust fan. Ultimately, by recording this data, we were able to show building officials how ventilation rates varied from 2 - 20 CFM of outside air per occupant and how that represented the relationship between operating costs and quality. The potential benefits of energy savings and improved indoor air quality are readily acceptable to the client.
What about the physical deployment of data loggers in school buildings?
HOBO® U12 series loggers U12-012, U12-006 (new model UX20-006M) are connected to Telaire 7001, then we conceal the device and place it in the marked brown metal thermostat box, perforated to allow the air around the room to pass through. The unassuming brown case is mostly for the curious to protect the instrument. This camouflage is very handy when trying to data log CO2 readings as exhaled breath directly onto the instrument can greatly affect the readings. Boxes are placed in the room at breathing zone height, but carefully placed away from residents to avoid direct precipitation, and away from doors, windows, and supply air diffusers to avoid room value dilution. This method follows ASTM and ASHRAE standard methods. We're also able to easily position records in a way that allows us to use light recording capabilities as well. This is useful in helping us see when rooms are vacant or when hallway lights are on, which can significantly increase operating costs as well
What tools did you use to interpret the data?
We first utilize hoboware®Pro BHW-PRO-CD, which is very useful for taking a quick look at the data. We can quickly take snapshots to interpret the data. Once we find out, select log data to be used in the calculations, and as close as possible to a typical representative day, based on the week's data and faculty interviews, we export to Microsoft for detailed analysis. In doing so, we are able to clearly see that HVAC areas, or are ventilating their respective classrooms. In the case of over-ventilation, this condition many times exceeds the ability of the HVAC system to dehumidify the excess of ventilated air, resulting in a large amount of untreated damp areas, which can eventually lead to mold growth in the space.
What role do data loggers play in mold surveys?
When it comes to HVAC equipment and ductwork, we've had people on projects complain about their mold coming out of the ductwork. Along with visual inspections, we can utilize these item wandering data loggers to fully assess the conditions within the HVAC equipment or ductwork. HOBO's data loggers have a range close to a good sensor for direct digital control, measurement and control of the operation of large construction machinery systems. We can bring HOBOs into the classroom, into mechanical systems, stick them inside the ducts, and get a pretty good idea of how the units deliver air through the system.
All in all, it sounds like school buildings pose a huge challenge when it comes to balancing indoor air quality with energy savings.
It's not just a South Florida phenomenon when it comes to ventilation. It happens everywhere. In schools, you are dealing with a balancing act of rapidly changing occupancy, varying occupant densities in the same air handling area, and changing functional spaces throughout the day. This can be quite a challenge. School often gets a bad rap because we hear it all the time, but it doesn't always work that way. Using the U12-012, U12-006 (new model UX20-006M) tool connected to the Telaire 7001 sensor, we can show the real data, who is making the decision. Data says it all.