Digital Color Communication: Understanding Colorimeters
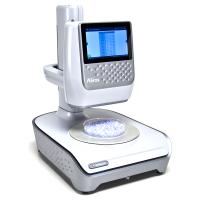
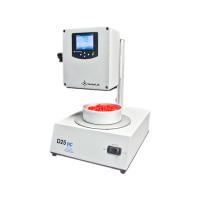
When it comes to digital color communications, a color Measurement Instrument (also known as a Colorimeter) or Spectrophotometer is one of the essential components in accurately capturing spectral data. Since the standard's spectral data will serve as reference data for everyone involved in the design and development process, it cannot be overemphasized that the data need to be truly representative of the standard. When the instrument used is reliable and reusable, spectral data can be accurately captured not only for itself but also for other similarly designed instruments. However, the importance of regular evaluation and maintenance cannot be overstated, as a Spectrophotometer is a precision scientific instrument and needs to be maintained as such to ensure long-term reproducibility.
In addition to regular evaluation and maintenance, instrument-to-instrument correlation can be used to improve inter-instrument agreement. Instrument correlation allows adjustment of spectral data to account for instrument drift due to environmental conditions and instrument use. Instrument dependency is not a substitute for routine maintenance, but it goes a long way toward ensuring that an instrument will perform as it did when it was first installed, after a few months of use. This is accomplished by measuring a set of target standards on the master instrument and then re-measuring these standards on the test instrument. Any variation in measurements can be accounted for by calculating correlation factors. These factors are then applied to the output of the Spectrophotometer when measuring any sample, effectively restoring the Spectrophotometer to its original factory specifications. Before calculating these correlation factors, diagnostics are required to ensure that the instrument is functioning properly. The benefit of instrument linkage is that all instruments in the supply chain can be brought closer together as the protocol between them and the master instrument improves.
Figure 1 shows the results of this correlation process, showing the changes in the Spectrophotometer relative to the master instrument before and after the correlation process. Prior to correlation, the maximum color difference of any correlated sample (ceramic BCRA tile) was CIEL*a*b*DE 0.243 and the average of all twelve correlated samples was 0.184, indicating a minor drift of 0.15 maximum beyond the original factory specification. The average CIEL*a*b*DE is 0.10. After correlation, the maximum color difference for any sample was 0.225, and the average dropped to 0.081. Additional improvements in correlation may only be possible with instrument service. Note also that an improvement in tile correlation does not guarantee an improvement in all colors of the various textile materials commonly used in retail/apparel products.
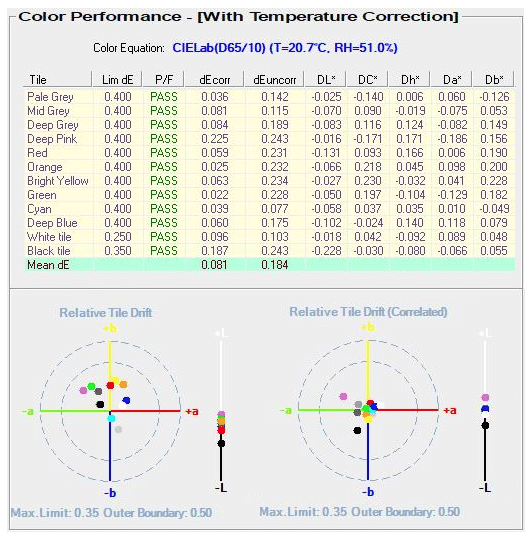
Figure 1 Correlation results of Spectrophotometer
Although adjusting digital color data through instrument correlation can improve Spectrophotometer output, variations in digital data due to instrument drift account for only a small, and usually minimal, potential variance in sample measurements throughout the supply chain.


- 1Application of Flame Atomic Absorption Spectrophotometry in Detection of Food Talc Powder
- 2Talking about the performance test of epoxy resin film coated on PET
- 3Spectrophotometer principle, structure and application do you know geometry?
- 4Principle, characteristics and application of ultraviolet Spectrophotometer
- 5Spectrophotometer Color Measurement Fundamentals
- 6What is the difference between tristimulus Colorimeter and Colorimeter?
- 7Differences between visible, ultraviolet-visible, infrared, fluorescent and atomic absorption Spectrophotometer s
- 8Detection of nicotine content by Spectrophotometer
- 9How to detect the color difference of fluorescent color-changing materials?
-
![KINGWELL JZ-300 general Colorimeter 8mm diameter, plastic, lame plating, Eletroplating, printing industry special]()
-
![CHNSPEC CRX-50 Online Colorimeter, Non-Contact Colorimeter]()
-
![CHNSPEC CRX-51 Non-Contact Colorimeter]() CHNSPEC CRX-51 Non-Contact Colorimeter$ 11243.00
CHNSPEC CRX-51 Non-Contact Colorimeter$ 11243.00 -
![CHNSPEC CRX-52 Automotive Paint Online Colorimeter]()
-
![INESA WSC-2S Colorimeter touch screen control, multi-interface output]()
-
![JZ-630 High Precision Colorimeter Suitable for Textile, coating powder industry color difference detection measurement diameter 14mm]()