Colorimetry: How to Measure Color Difference
Colorimetry is the science of color measurement widely used in commerce, industry and laboratories to represent color numerically and measure the color difference between samples. Applications include paints, inks, plastics, textiles and apparel, food and beverages, pharmaceuticals and cosmetics, displays, and other parts and products that reflect or transmit color.
The use and importance of colorimetry has grown in tandem with the increase in manufacturing and processing across the globe. For example, when a plastic automotive trim produced on one continent needs to match a painted metal finish applied on another continent, it is necessary to have an objective and accurate description of the color.
Unfortunately, human perception of color varies widely and is affected by lighting, sample size, surrounding colors, and viewing angle. Colorimetric instruments provide a standardized set of conditions to help ensure consistency and reproducibility.
Although the term "colorimetry" is often used in a general sense to refer to color measurement, it is distinct from spectrophotometry, which is a related but distinct method of color measurement.
In colorimetry, the quantification of color is based on the three-component theory of color vision, which states that the human eye has receptors for three primary colors (red, green, and blue) and that all colors are seen as mixtures of these primary colors. In colorimetry, these components are called XYZ coordinates. A Colorimeter based on this theory of color perception uses three photocells as receivers to see color in much the same way as the human eye.
Spectrophotometry, on the other hand, uses many more sensors (40 or more in some Spectrophotometer s) to split the reflected or transmitted beam into its component wavelengths. It measures the spectral reflectance of an object at every wavelength along the visible spectral continuum. Spectrophotometry is highly accurate and is commonly used in research and color formulation applications. Colorimeters are commonly used in production and quality control applications.
Colorimeter
The structural Colorimeter consists of a light source, observation optics of fixed geometry, three photocells matching internationally established standard observers, and an on-board processor or cable connected to a processor/display unit or computer.
In operation, a Colorimeter's sensor lens is typically placed directly over the sample area to be measured, such as a piece of dyed cloth or a piece of colored plastic. For liquid or colored film samples that need to measure transmitted light, place the sample in the transmission chamber of the instrument or in a dedicated sample holder. Next, the operator activates a light source that reflects off the sample and passes through three photocells, which determine the red, green and blue components and transmit the data to a microcomputer. The microcomputer calculates the XYZ tristimulus values and captures the data for display or printing.
Although tristimulus values can be used to define color, they cannot easily display color. Therefore, under the auspices of the International Commission on Illumination (CIE), many mathematical models and mapping methods have been developed. These conceptualizations are called color spaces. A color space more closely represents the relative properties of a color, such as lightness, saturation (chroma), and hue. They are especially useful in measuring and comparing color differences between two samples, such as target colors that need to be reproduced repeatedly during production.
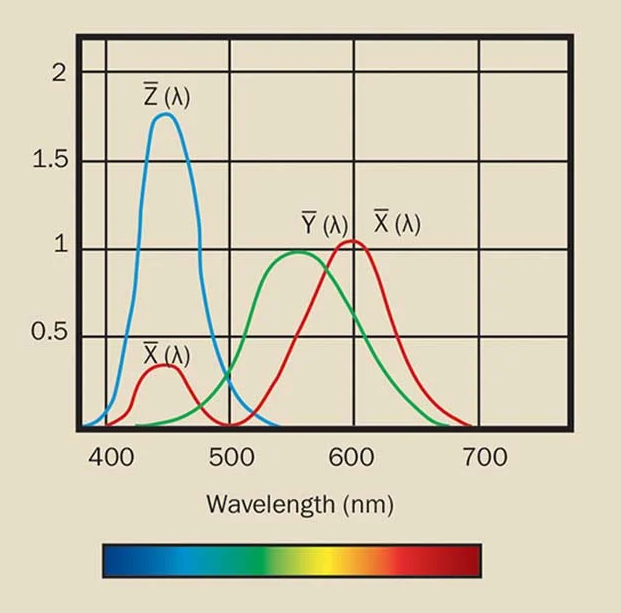
Hue is the term used for the general classification of color - the region of the visible spectrum (380 to 700 nm) where the greatest reflectance of light occurs. Hues perceived as blue tend to reflect light at the low end of the spectrum, green in the middle region and red at the high end. Figure 1 shows the spectral sensitivity corresponding to the human eye
Lightness/Darkness can be measured independently of Hue. For example, the brightness of a lemon can be compared to the brightness of a cherry. Saturation describes the perceived vibrancy/sharpness of a color and, like lightness, can be measured independently of hue.
Widely used color spaces for defining and expressing these properties mathematically include the CIE's Yxy color space (founded in 1931). 1976 L*a*b* color space; and L*C*h color space. Other color spaces such as CIELUV; Hunter Laboratories, developed by Richard S. Hunter; and the Munsell color notation system are also in use.
Over time, color space representations have been refined to correspond more closely to the human eye's perception of color difference, as defined through ongoing experimentation and statistical averaging.
XYZ values and Yxy color space
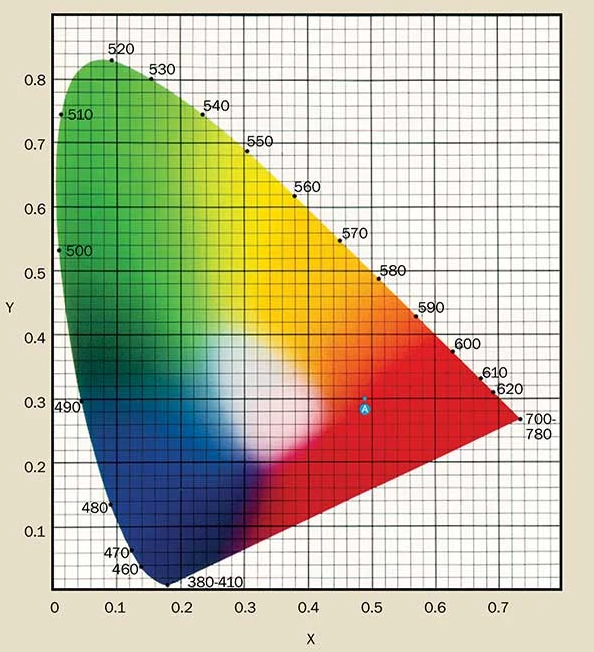
One of the earlier representations of color spaces is the CIE 1931 X, Y chromaticity diagram (Figure 2). This map is used for two-dimensional graphing of color, independent of brightness. X and Y are the chromaticity coordinates calculated from the tristimulus values XYZ. In this figure, achromatic colors increase towards the center and chroma increases towards the edges. A red apple measured colorimetrically with chromaticity coordinates X = 0.4832 and Y = 0.3045 can be located at position A (blue circle) in this color space.
The L*a*b* color space, also known as CIELAB, was released in 1976 to accommodate one of the problems with the original Yxy color space. Equal distances on the X,Y chromaticity diagram do not correspond to equal perceived color differences. In the L*a*b* diagram, the sphere is solid, L* represents lightness, and a* and b* are chromaticity coordinates. Here, a* and b* indicate the color direction (+a* is the red direction, -a* is the green direction).

Figure 3. a*, b* chromaticity diagram.
The L*C*h color space uses the same map as the L*a*b* color space, but uses cylindrical coordinates instead of Cartesian coordinates. L* is the same as L* of the L*a*b* graph. C* is chroma and h is hue angle. For achromatic colors, the value of C* is 0 at the center and increases with distance from the center. The hue angle is defined from the +a* axis and expressed as degrees when the chromaticity axis is rotated counterclockwise.
The measurement output of the Colorimeter is expressed in units of the XYZ values of the sample under test as well as other acceptable uniform color spaces. By comparing the measured value of a target color to a sample sample, the user not only obtains a numerical description of the color, but also expresses the nature of the color difference between the two samples being measured. Colorimeters pinpoint the brightness, chromaticity, and colorimetric differences between the target and sample.
Color measurements made at one location and expressed in units of a given color space can then be compared with measurements made at another location or at another time and communicated in an internationally recognized language. In this way, colorimetric measurements remove subjectivity from color perception and judgment of color differences.
With today 's Colorimeters, a variety of tristimulus Colorimeters are available for production color sampling, inspection and color quality control. Many portable, battery-operated devices allow for objective color measurements on the production floor or in remote locations. They come in a variety of apertures and illumination/viewing geometries for specific applications, various levels of data processing capabilities, and numerous accessories.
Microscope-like Colorimeters are used to precisely measure small objects such as pills and pharmaceutical reagents. Non-contact Colorimeters measure the color of textiles, paper and coated rolls on the production line online. Small handheld instruments are even designed for very specific applications such as contrast measurement of baked, fried and processed foods.
By closely monitoring the consistency of color in production and processing operations, business and industry dramatically reduce the cost of waste and product scrap while increasing operational efficiency and productivity.
- 1How to detect the color difference of fluorescent color-changing materials?
- 2How does Colorimeter detect particulate matter (PM) color differences?
- 3Application in color difference detection of automobile surface painting
- 4Measuring Color Difference in the Coatings Industry
Cheryl Roberts
- 5Is it possible to measure the hidden percentage of artificial heather, fences and hedges?
- 6What is spectroscopy?
- 7Briefly describe the definition of chromatic aberration and whiteness in Colorimeter
- 8How to solve the color difference of real stone paint from production and construction
- 9How to control color difference in coating powder production