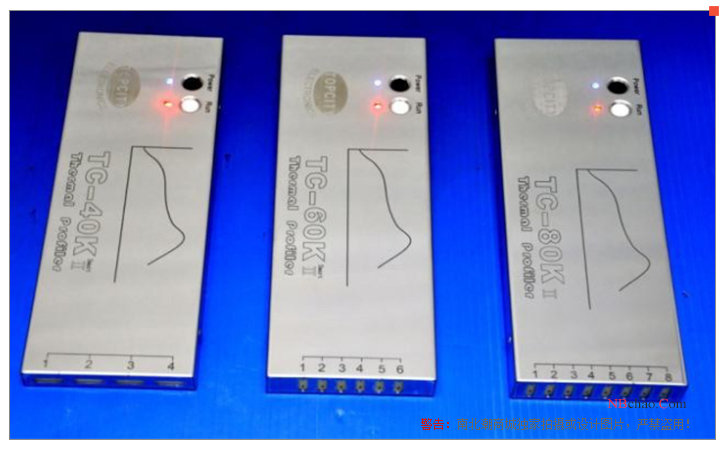
Furnace temperature tracker TC-60K DAQTECH six test channels, electronic, painting, tunnel furnace temperature test
SE
DAQTECH TC-60K Furnace temperature trackerSPEC
DAQTECH TC-60K Furnace temperature trackerDetails
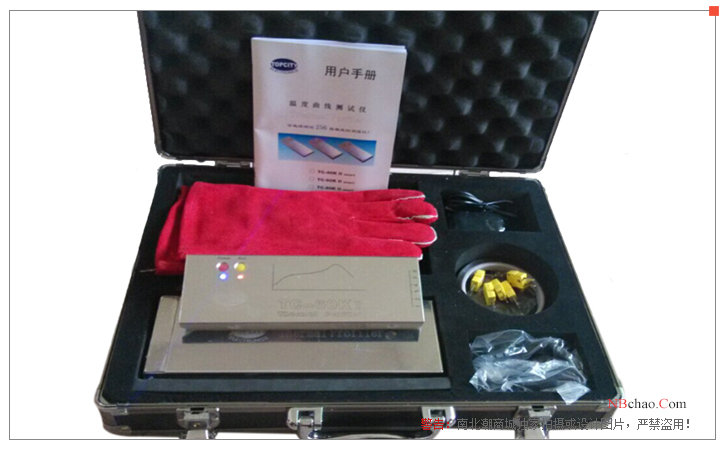
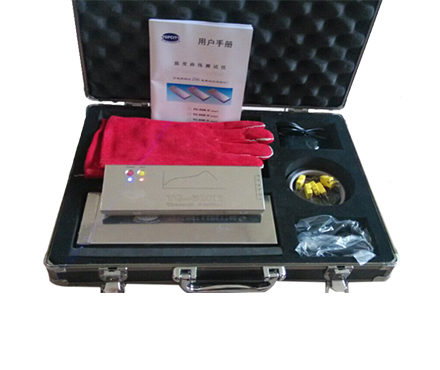
DAQTECH TC-60K Furnace temperature trackerPacking list
- SKU
- NB001229
- Number of channels
- 6
- Probe Type
- K type
- temperature Measurement Range
- -100~1200℃
- temperature measurement Accuracy
- ±1℃
- Sampling interval
- 0.05-600 seconds, software settings
- resolution
- 0.1 ℃ (full scale)
- Storage Capacity
- 120,000 points/channel
- Total power
- ≤100mW
- Power
- 3.6V (built-in rechargeable battery)
- Connectivity
- RS-232 or USB (optional)
- Recorder size
- 208*75*20mm
- Insulation box size
- 252*88*30mm
- wingspan width
- 98-218mm (std.)
- Analysis software
- e-DataPro Chinese and English three languages
Introduction
Dafengke TC-60K furnace temperature tracker is a six-channel tunnel furnace temperature Tester, which uses K-type thermocouples, can continuously test 256 sets of temperature curves and can divide 15 temperature zone segments. TC-60K furnace temperature tracker provides accurate furnace temperature curve test, with professional analysis software, according to the measured wave soldering and reflow soldering furnace temperature curve test, it can provide accurate judgment and optimization for process indicators, and can realize solder paste information and equipment information , Product information management and editing horizontal temperature line and time point line. The temperature measurement range of TC-60K furnace temperature tracker is -100~1200℃.
Applications
TC-60K furnace temperature tracker is widely used in the temperature consideration of SMT placement and plug-in PCB welding process in the electronics industry, and can also be used for temperature mapping and analysis in food, environment, coating, oven, tunnel furnace and other industries.
Temperature curve analysis setting function
1. Add process index (PWI) analysis
2. Increase solder paste information management
3. Increase equipment information management
4. Increase product information management
5. The horizontal temperature line and time point line can be moved and edited
6. The data will not be lost when the instrument is powered off
7. The Recorder can continuously record 256 groups of temperature data, and download them in one group.
8. Set the temperature and transportation speed in the temperature zone of the reflow furnace and the wave peak furnace
9. Location name of temperature sampling point and schematic diagram of PCB
10. Time between two temperature values
11. The slope between two temperature values
12. The slope between two time points
13. The time beyond the specified temperature
14. Maximum temperature and temperature at any point in time
15. Horizontal temperature line, vertical time line and the time between the two times
16. Mesh editing refinement and curve zoom display
17. Simulation curve function, process optimization, test date and time
18. Input of company name, product name and remarks
19. Select the printing direction (landscape printing and portrait printing)
20. The temperature data report can be exported to Excel for editing
21. The function of inserting pictures makes the position of the temperature test point clear at a glance
22. Call multiple sets of temperature curves for comparison
23. Two Operating Modes of real-time monitoring and instrument recording
24. Manually clear and software clear instrument memory data methods
25. Three starting modes: manual, specified time, and specified temperature
Pictures