
FANGRUI Viscometer DV software, not sold separately
SE$132.00/set
PromotionLoading...
Coupon
Model:
 DV software

FangRui DV software ViscoMeter DV SoftwareSPEC
FangRui DV software ViscoMeter DV SoftwareDetails
FangRui DV software ViscoMeter DV SoftwarePacking list
- SKU
- NB029786
DV software
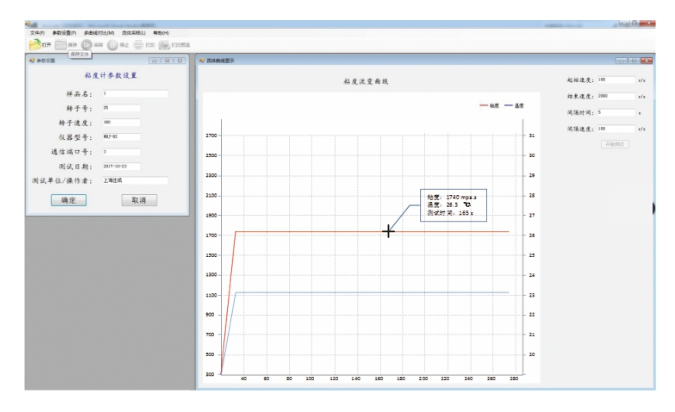
ViscoMeter DV Software
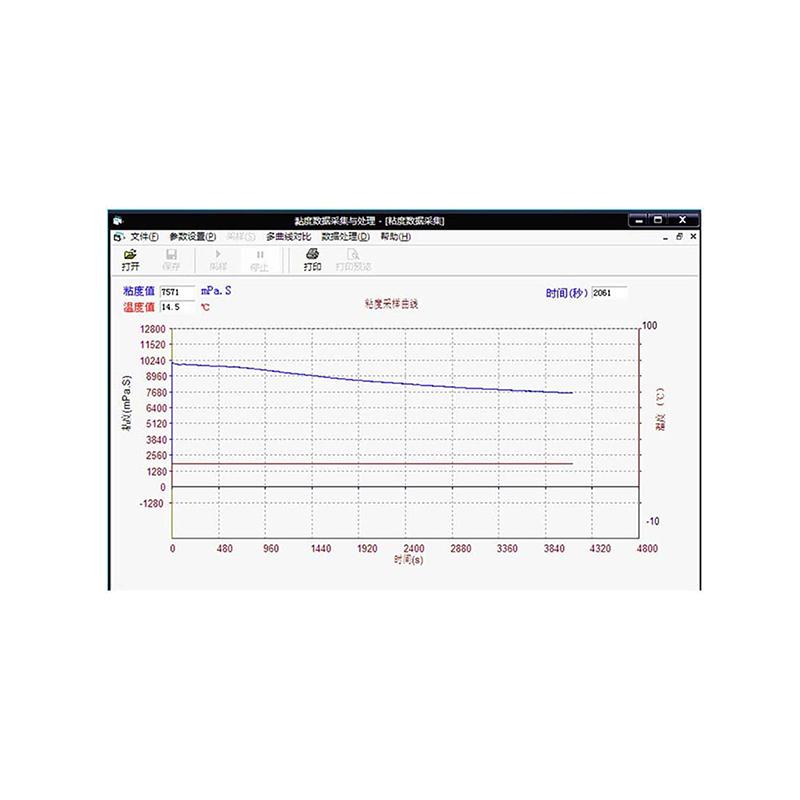
Automatically collect viscosity changes and generate curves in real time, and the curves and data can be accessed and printed;
The measured curves can automatically provide the temperature and viscosity corresponding to different times;
It can provide comparative analysis of up to 15 curves in the same coordinate;
FAQ
QIs the price listed on the website the final cost for overseas purchases?
ANo, it isn't. This is the ex-factory price of the product in the Chinese Mainland. In addition to this price, buyers from different countries need to account for additional costs such as shipping fees, tariffs, and others. For specific regional quotes, please consult our customer service or fill out a quotation form.
QWhat is the specific process for purchasing the product?
AFirst, please click on the quotation form on the website and fill in detailed information. Our customer service personnel will then send you a quotation based on your specific country and region, confirming payment and delivery methods. Following this, we proceed with contract signing, payment, and shipment. You can then await delivery.
QWhat should I do if the instrument I purchase needs repair?
AAfter-sales repair for overseas instruments is an unavoidable issue. Our repair terms stipulate that the sender is responsible for the shipping and insurance costs incurred for the repair. Repairs within the warranty period are free, while repair costs beyond the warranty period are determined based on the actual situation.
Knowledge
- 1Installation and use of Fangrui Rotational Viscometer No. 0 rotor
- 2Working principle and application of Spinning & weaving slurry Viscometer
- 3The relationship between paste ink and viscosity (viscosity)
- 4 What are Newtonian and non-Newtonian fluids?
- 5The basic knowledge of viscometer is enough to read this article
- 6Basic concepts, principles and measurement methods of viscosity
- 7Thixotropic Cracking Coefficient Method for Determination of Ink Rheology
- 8Comparison of 3 viscosity measurement methods: capillary method, rotation method, falling ball method
- 9What are the specific requirements for rheology of latex paint?
- 10What are non-Newtonian fluids?